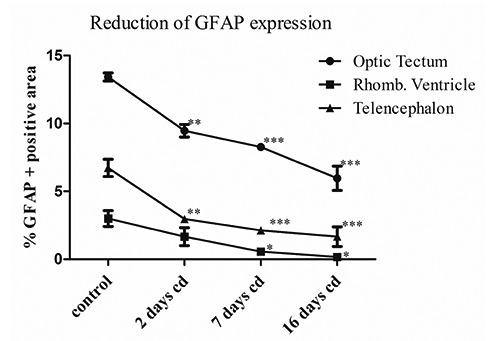
Figure 4.

Graphical representation of the mean percentage values of GFAP immunopositive area for optic tectum, rhombencephalic ventricle, meningeal surface of telencephalon in Podarcis siculus encephalon. The values are significantly reduced for each encephalon part relative to the same part of control animals: *P<0.05; **P<0.01; ***P<0.001.
