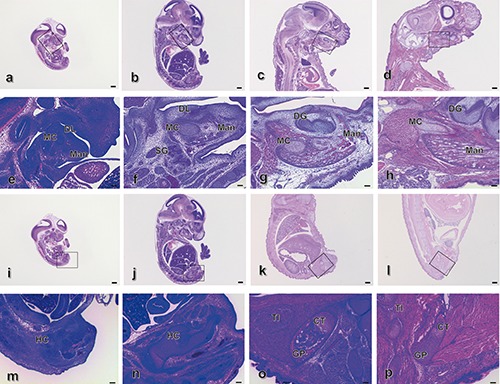
Figure 1.

Haematoxylin and eosin (HE) staining of sagittal sections of mouse heads at E12.5 (a,e), E14.5 (b,f), E17.5 (c, ìg) and P1 (d,h) and tibias at E12.5 (i,m), E14.5 (j,n), E17.5 (k,o) and P1 (l,p). e) Magnification of the squared region in (a); f) magnification of the squared region in b); g) magnification of the squared region in (c); h) magnification of the squared region in (d); m) magnification of the squared region in (i); m) magnification of the squared region in (j); o) magnification of the squared region in (k); p) magnification of the squared region in (l). Mad, mandible; BT, bone trabecula-like matrices; MC, Meckel’s cartilage; DL, dental lamina; DG, dental germ; TI, tibia; HC, hyaline cartilage. Scale bars: a-d, i-l), 500 µm, magnification: 0.71x; e-h, m-p), 100 µm, magnification: 4x.
