Figure 6.

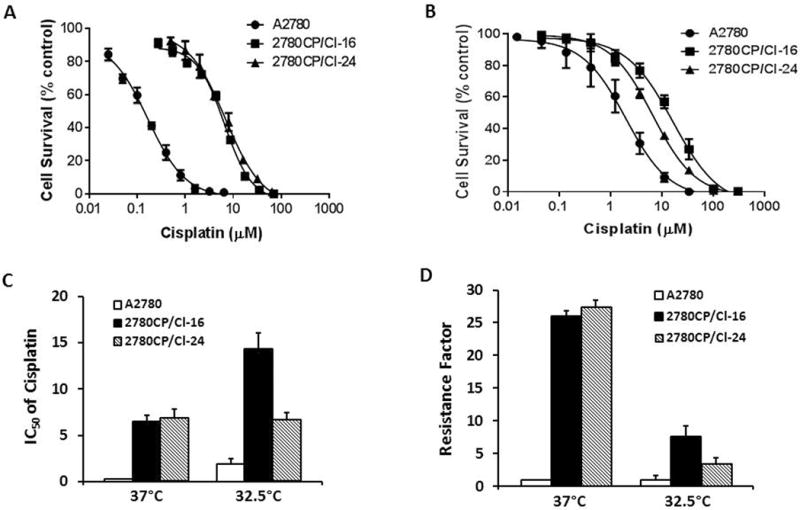
Cisplatin-resistant tumor cells demonstrate reduced resistance when grown at 32.5°C. Tumor cells grown at 37 °C (A) or 32.5 °C (B) were used to determine dose-response curves for cisplatin following growth-inhibition analysis by the MTT assay. The IC50 values (C), generated from dose-response curves in A and B, were used to determine resistance factors (D). The results are shown as mean ± SD of three independent experiments.
