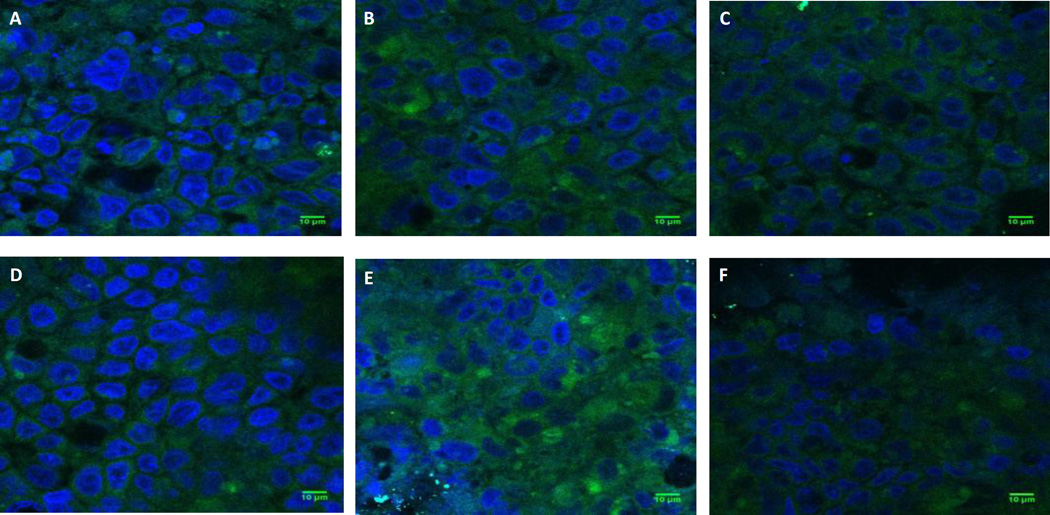
Figure 7.
Confocal micrographs of uptake of nanoparticles of different shapes and surface chemistries by Caco-2/HT-29 cells. Representative confocal microscopy images showing uptake of A) Spheres; B) Rods; C) Discs; D) Biotin conjugated Spheres; E) Biotin-conjugated Rods and F) Biotin-conjugated Discs by Caco-2/HT-29 cells at the end of 5 h of study. Green fluorescence represents particles while blue color represents cell nuclei (DAPI staining). Scale bar = 10 µm. It is to be noted that upon stretching 200 nm spheres into rods and discs, the fluorescence of the stretched particles diminishes by approximately 1.5 and 3 fold respectively compared to spheres. Therefore, despite attenuated fluorescence, rods demonstrate higher uptake than spheres in Caco-2/HT-29 cells.

