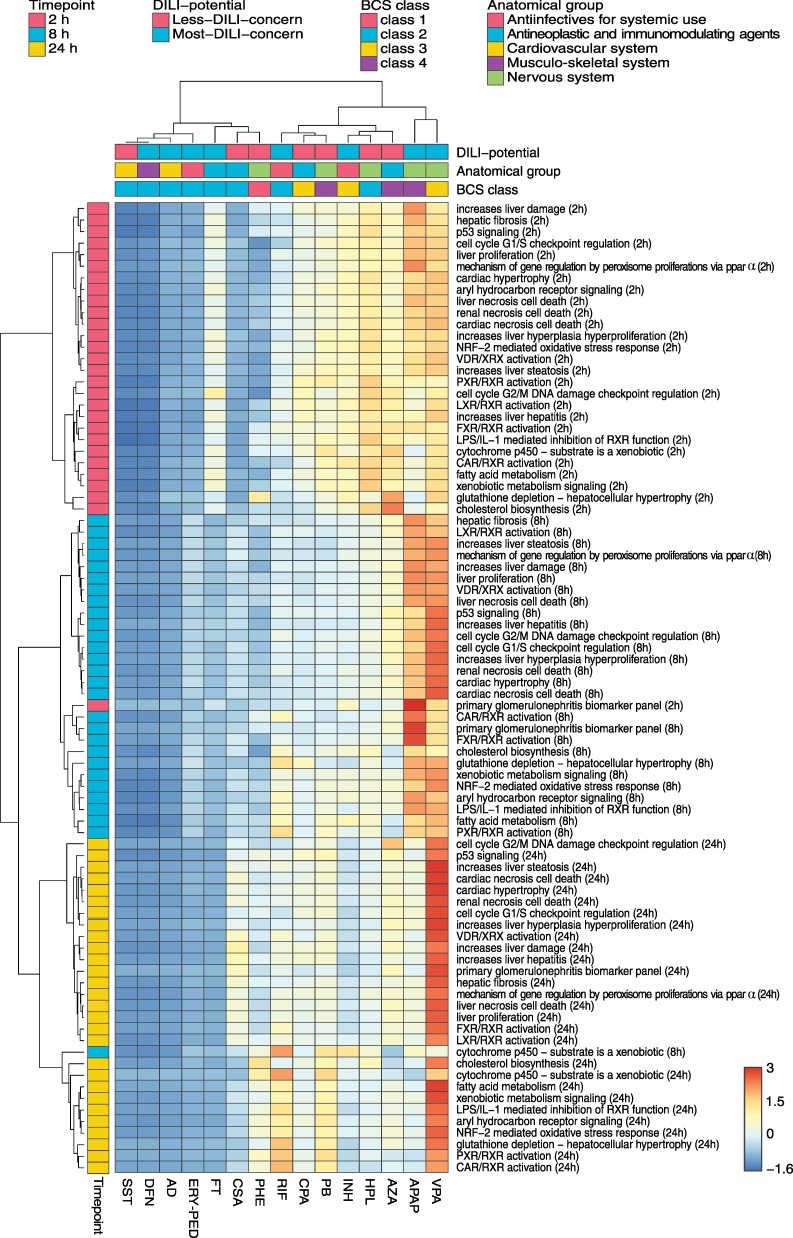
Fig 6. Comparative toxicity analysis of key cellular processes in humans.
Toxic changes in perturbed key cellular processes (S2 Table) were calculated for fifteen hepatotoxic drugs at 2 h, 8 h and 24 h. The drugs were annotated with their respective DILI-potential, the BCS class and the target organ or system (S1 Table). The dendrograms were constructed using the Ward's minimum variance algorithm. The color scale depicts normalized toxic changes. The heatmap was visualized by use of the web tool ClustVis [76]. Row-normalization is performed by subtracting the mean and by dividing the respective standard deviation.

