. 2017 Feb 2;13(2):e1005280. doi: 10.1371/journal.pcbi.1005280

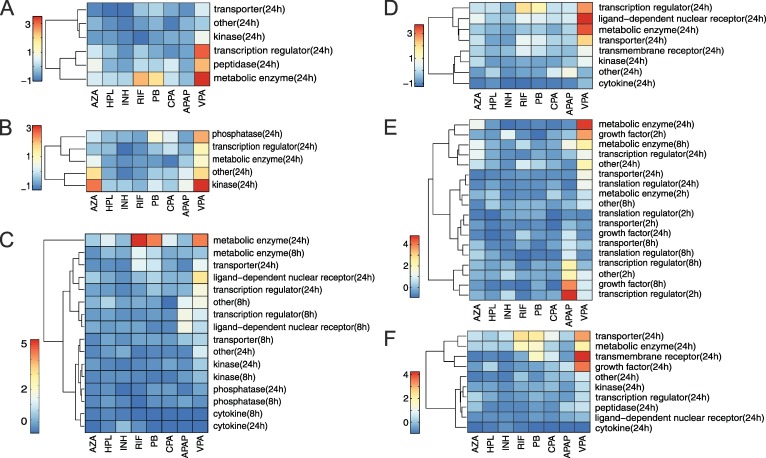
Fig 7. Toxic changes predicted for functional classes of genes involved in key cellular processes.

Fig 7

The toxic changes were predicted for different functional classes of genes involved in the respective key cellular processes. All drugs belonging to the high-responsive group were considered. The color scale depicts toxic changes that were normalized over each heatmap. Normalization for each key cellular process is performed by subtracting the mean and by dividing the respective standard deviation.
  • A
    ‘NRF-2 mediated oxidative stress response’.
  • B
    ‘Cell cycle G2/M DNA damage checkpoint regulation’.
  • C
    ‘PXR/RXR activation’.
  • D
    ‘LPS/IL-1 mediated inhibition of RXR function’.
  • E
    ‘Primary glomerulonephritis biomarker panel’.
  • F
    ‘Aryl hydrocarbon receptor signaling’.