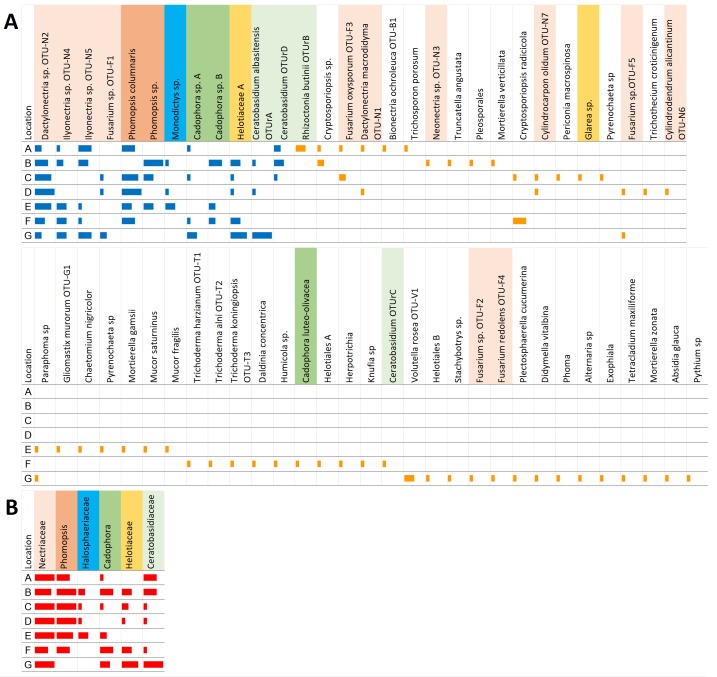
Figure 2. Abundance of the 12 common (blue bars) and 49 rare (orange bars) OTUs at each location.
(A) Three roots from each of two plants were cultured from each location; with six roots per location, the isolation of the same OTU from all six roots from the same location scored a maximum score of 6 for abundance (fully horizontally extended bar). (B) Distribution of the OTUs in each location after their grouping into families (red bars).

