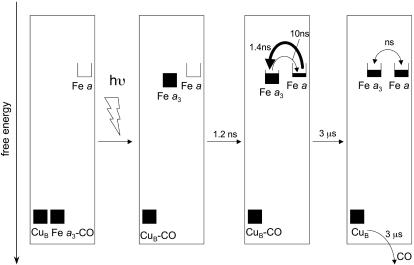
Fig. 5.
Scheme summarizing our findings. The boxes reflect filling of the reduced forms of the redox centers. Starting from the MV-CO complex, CO photolysis from heme a3 results in its binding to CuB and a rise of the effective midpoint potential of heme a3. Electron redistribution between the two hemes according to the new equilibrium occurs in 1.2 ns. We suggest that the previously observed 3-μs ET phase (transition to rightmost box) reflects a modest change in redox equilibrium due to CO migration out of the active site.

