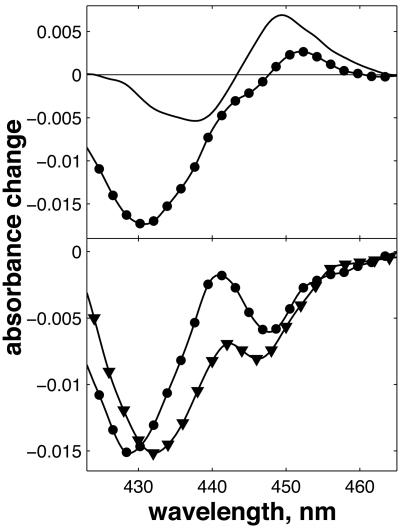
Fig. 6.
Simulation of this spectrum associated with the 3-μs ET phase. (Upper) Solid line, the 1.5-μs phase in FR CcO taken from ref. 24; circles, the 1.2-ns ET component measured in the MV complex, taken from Fig. 4. The amplitude ratio between two phases was taken as 100% for the 1.5-μs FR phase and 25% for the 1.2-ns phase. (Lower) The sum of the 1.2-ns phase and the inverse (the sign convention in ref. 24 is the inverse of ours) of the 1.5-μs phase (circles) and the spectrum of the 3-μs ET phase shown in ref. 4. Solid lines between points are splines to guide the eye.

