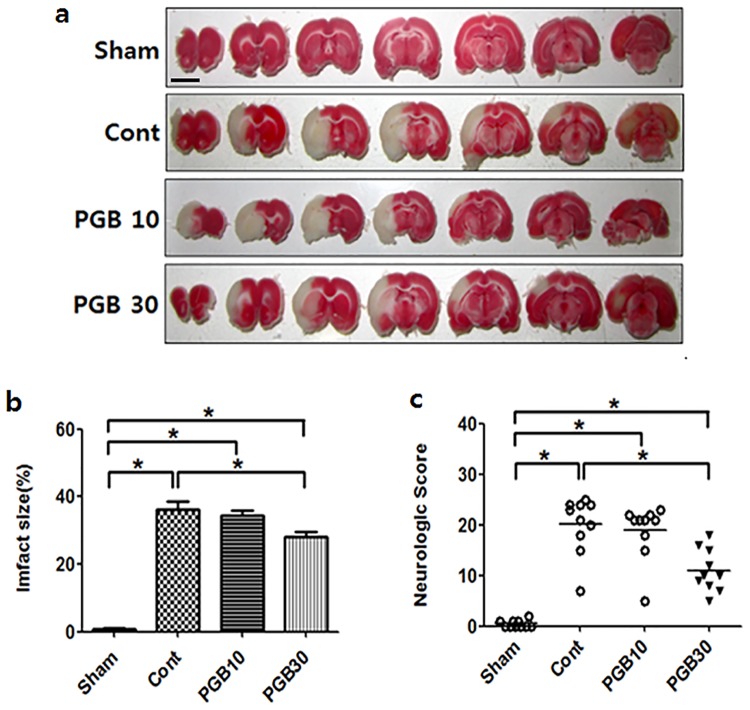
Fig 1. Determination of the dose range for pregabalin treatment.
Rats were treated with the indicated dose (mg/kg) of pregabalin (PGB). Representative pictures of TTC-stained brain sections from rat in the different group (a); Infarct volumes expressed as a percentage of area at risk (b); Neurological deficit scores (c). Values are mean ± SD from 8 independent rats. *P <0.05. Scale bar: 1 cm.

