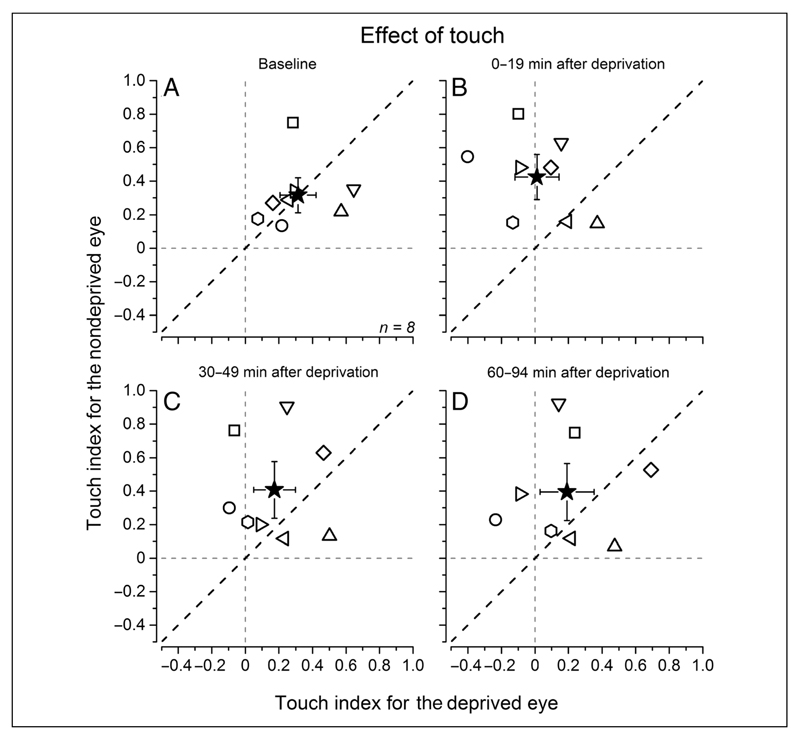
Figure 5.
Individual participants’ data. The touch index (computed for each participant as the area subtended by the probability curves as illustrated in Figure 4) on the deprived eye plotted for each participant against the touch index for the nondeprived eye measured before (A) and at different times after deprivation (B–D). The black star represents the average across all participants, and the error bars represent 1 ± SEM. After deprivation (B, C, and D), the magnitude of the visuo-haptic effect is higher for the nondeprived eye than the deprived eye (data points scattering above the equality dashed black line). The vertical and horizontal gray dashed lines represent the absence of visuo-haptic effect.

