Figure 1.

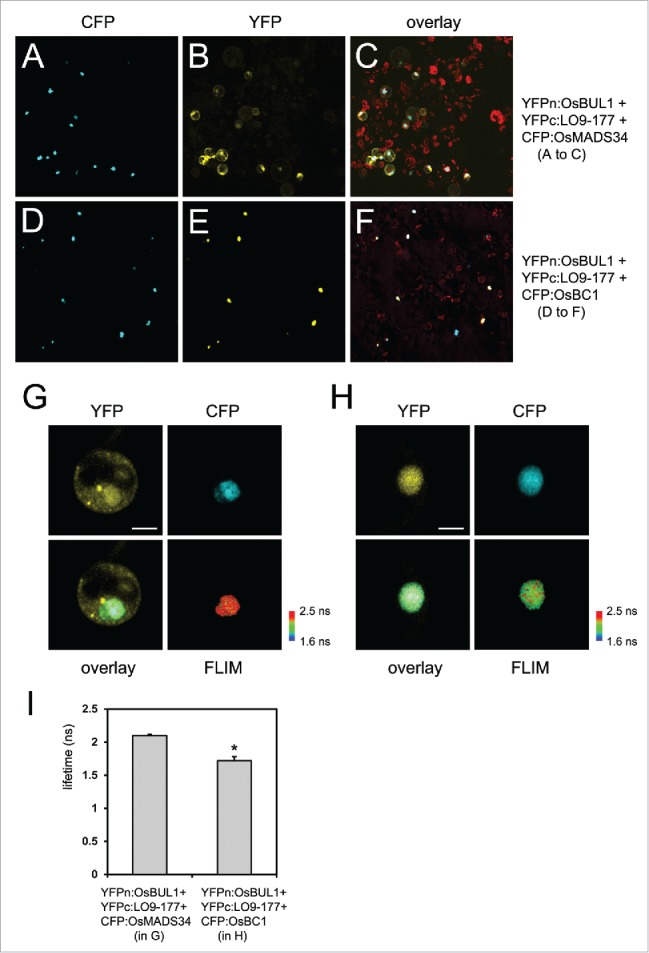
Protein localization and interaction. (A-C) CFP:OsMADS34, YFPn:OsBUL1 and YFPc:LO9–177 were introduced into rice protoplasts. CFP signals were exclusively detected in the nucleus (A) while florescent signals from reconstituted YFP are in the cytoplasm as well as the nucleus (B). (C) Merged image of CFP and YFP signals with auto-florescence from chloroplasts. (D-F) CFP:OsBC1, YFPn:OsBUL1 and YFPc:LO9–177 were introduced into rice protoplasts. YFP signals from YFPn:OsBUL1 and YFPc:LO9–177 as well as CFP signals were only found in the nucleus (D, E) suggesting the formation of a trimeric complex in rice cells. (F) Merged image of CFP and YFP signals with auto-florescence from chloroplasts. FRET-FLIM images in the nucleus containing YFPn:OsBUL1, YFPc:LO9–177 and CFP:OsMADS34 (G) and YFPn:OsBUL1, YFPc:LO9–177 and CFP:OsBC1 (H). (G-I) FRET-FLIM analyses show significant changes in the lifetime of CFP from the CFP:OsBC1 fusion when OsBUL1 and LO9–177 were co-transformed compared with the control, CFP:OsMADS34 was transformed together with OsBUL1 and LO9–177 (*, Student's t test: P < 0.01). ns; nanoseconds. Scale Bars, 10 µm in (G, H). Image and data acquisition was obtained with a Leica TCS SP5, combined with a PicoHarp 300 TCSPC Module and a Ti:Sapphire multiphoton laser (Coherent). The samples were excited with a 840 nm pulsed laser (80 MHz). The emission was recorded from 470 nm to 510 nm in 512 × 512 pixel images with at least 500 counts/pixel. The fluorescence lifetime measurements were analyzed using the PicoQuant SymphoTime Software (ver. 5.3.2.2). For each nucleus average fluorescence decay profiles were plotted and lifetimes were estimated by fitting the data with a double-exponential decay function.
