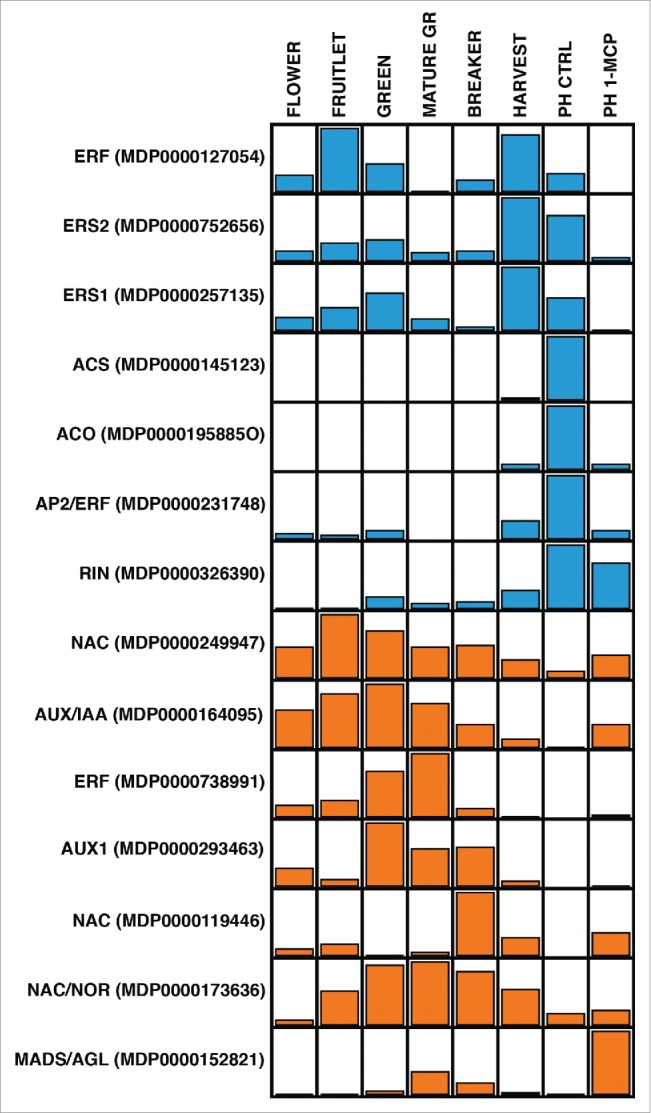
Figure 1.

Expression profile of 14 candidate genes throughout the apple fruit development and ripening. Stages are reported on the top of the figure. The last stage PH (postharvest) is further distinguished in control (CTRL) and treated with 1-methylcyclopropene (1-MCP). For each gene the name and the ID (according to the GDR database) are reported. The pattern of gene expression is moreover characterized by different colors. While in blue are highlighted genes induced by ethylene and repressed by 1-MCP, in orange are instead depicted the elements with an opposite regulation, thus stimulated by the ethylene competitor 1-MCP.
