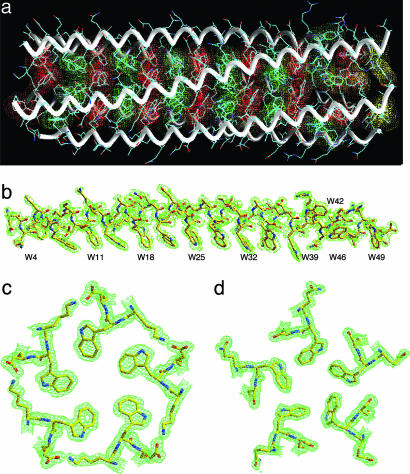
Fig. 3.
Crystal structure of Trp-14. (a) Side view of the pentamer. Red van der Waals surfaces identify tryptophans at the a positions, green surfaces identify tryptophans at the d positions, and yellow surfaces identify the C-terminal-most tryptophan d layer. (b) The 2Fo - Fc electron-density map at 1.0σ contour superposed onto the final model of the C helix. Electron densities are shown in broken lines to clarify the drawing. (c) The 2Fo - Fc electron-density map (contoured at 1.0σ) showing the cross-section of the pentamer in the W18 (a) layer. (d) The cross-section of the pentamer in the W21 (d) layer.

