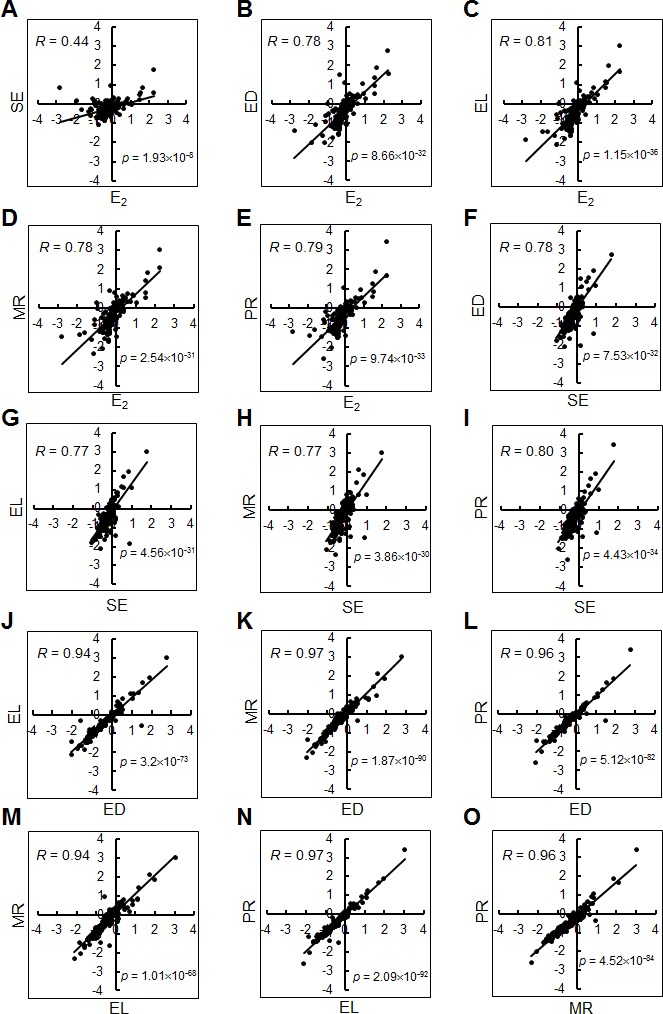
Fig 2. Estrogenic gene expression profiles of lignans revealed by DNA microarray assay.
Correlation of gene expression profiles was examined between individual pairs of E2 and lignans. The gene expression profiles for these chemicals were compared using a set of 150 estrogen-responsive genes in scatter-plot graphs. The vertical and horizontal axes indicate log2 values of the signal intensities. R- and p-values were calculated for each graph on the basis of linear regression between two profiles.

