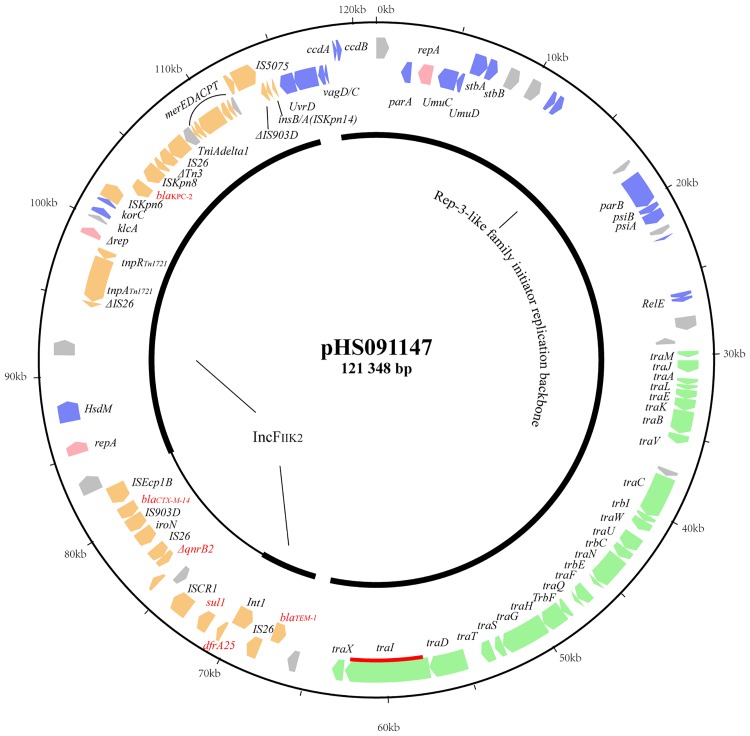
Fig 1. Circular map of pHS091147.
Genes are color-coded dependent upon functional annotations as follows: pink, replication; blue, stability; green, propagation; orange, adaptation (the MDR region); grey, other functions and hypothetical proteins. The relaxase gene (traI) is indicated by the red bar. Red text highlights the resistance genes: blaKPC-2, blaTEM-1, blaCTX-M-14, dfrA25, sul1 and ΔqnrB2.

