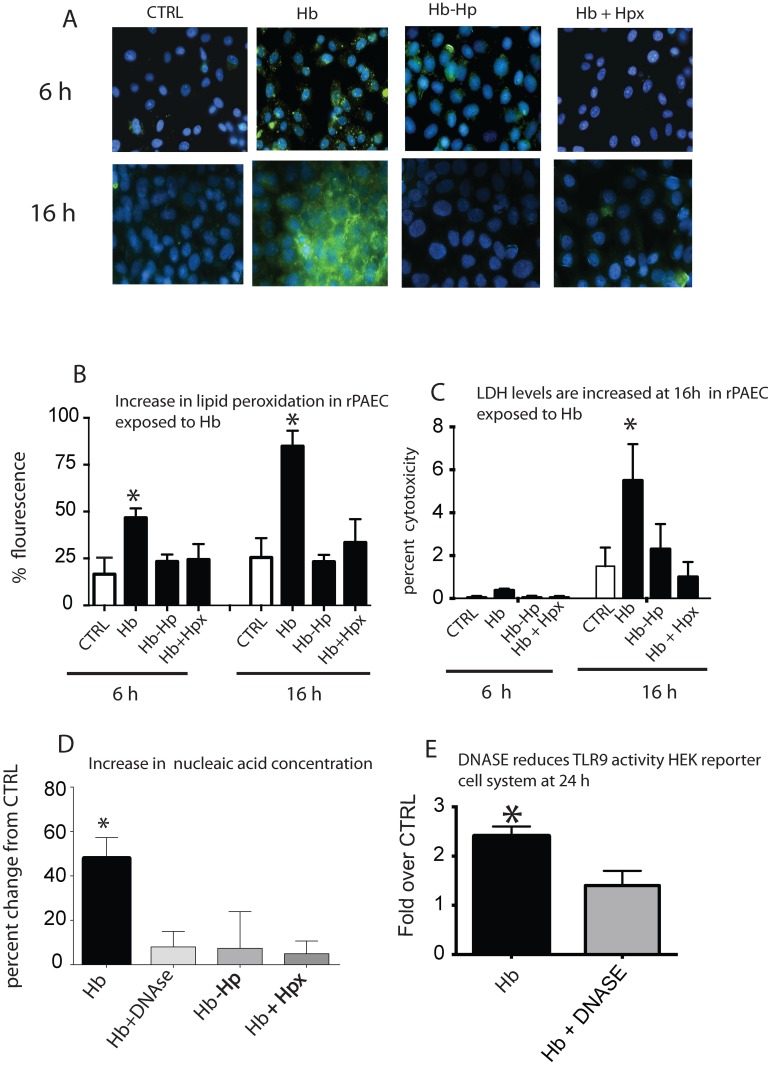
Fig 3. Lipid peroxidation, cell death and nucleic acid accumulation.
(A) Photomicrographs that show areas of lipid perioxidation in rPAEC exposed to Hb (25 uM heme) in the presence or absence of haptoglobin or hemopexin. (B) Image J quantification of lipid peroxidation. (C) LDH levels in culture supernatant in rPAEC expose to Hb. (D) Nucleic acid concentrations in culture supernatant exposed to Hb. (E) HEK-blue TLR9 reporter cell activity in cells treated with Hb in the presence or absence of DNASE. *p<0.04 vs. ctrl. Green lipid peroxidation- (White arrows). Hb- hemoglobin Hp-haptoglobin, Hpx- hemopexin.

