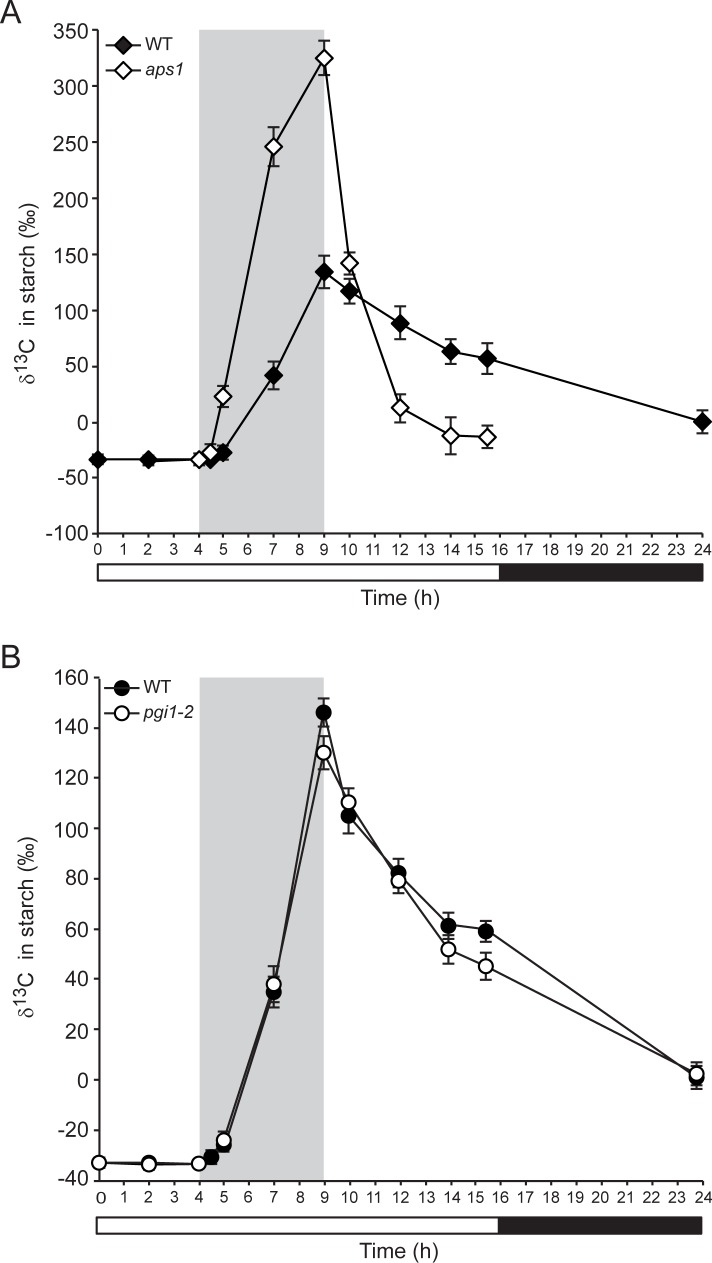
Fig 4. Isotope ratio mass spectrometric evidence for the occurrence of starch cycling in illuminated leaves through a mechanism involving AGP.
The graphics represent the values of δ13C in starch of leaves of (A) 26 DAS WT (Col-0) and aps1 plants, and (B) 22 DAS WT (Ws-2) and pgi1-2 plants exposed to 13C enriched CO2 for 5 hours and then chased for 15 additional hours. Plants were cultured in growth cabinets under long day (LD) conditions. The grey area indicates the 13CO2 pulse period. Starch content in leaves is shown in S4 Fig. Values represent the means ± SE determined from three independent experiments using 6 plants in each experiment.

