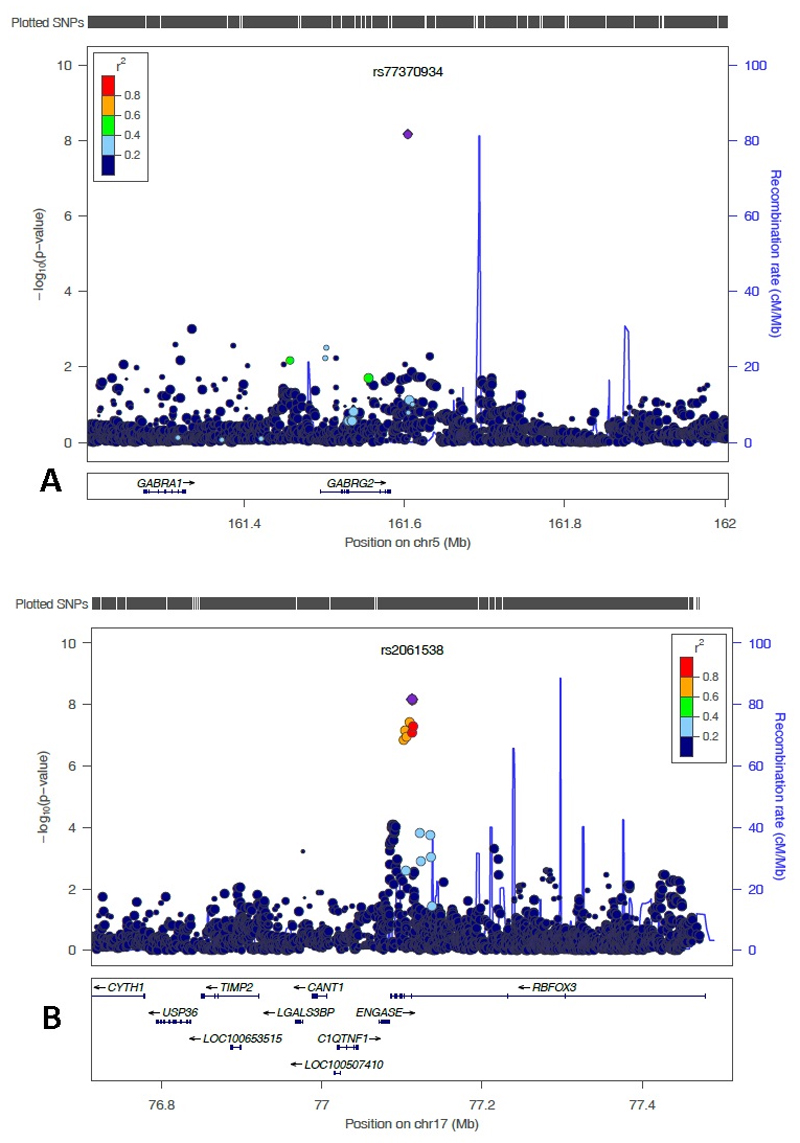
Figure 3.
LocusZoom plot of most strongly associated SNPs from the meta-analysis located in A) the region of most significantly associated genes
A) The RBFOX3 (chromosome 17 centred around SNP rs2061538 (shown in purple). Linkage disequilibrium (based on r2 values) with respect to rs2061538 are based on the CEU reference population.
B) The GABRG2 (chromosome 5 centred around SNP rs77370934 (shown in purple). Linkage disequilibrium (based on r2 values) with respect to rs77370934 are based on the CEU reference population.

