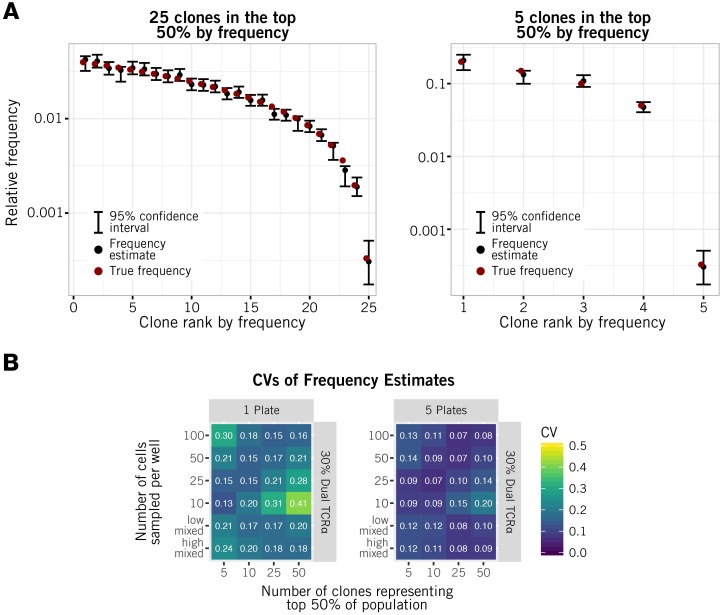
Fig 4. Assessment of the precision of clonal frequency estimation.
(A) Point estimates of clonal abundances generated by alphabetr, derived from representative simulations using five plates and distributions with 25 and 5 clones in the top 50% (left and right panels respectively). (B) The coefficient of variation (precision) of abundance estimates for a range of skewnesses of clone sizes and sampling strategies. Values quoted are averages over 100 simulations.

