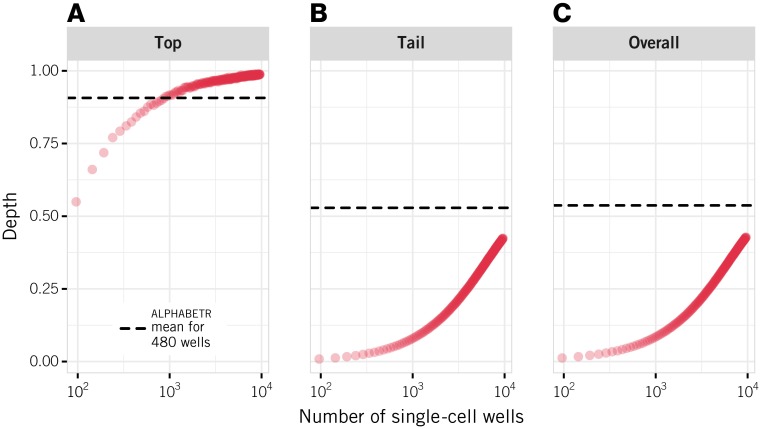
Fig 6. Comparison of single-cell approaches and alphabetr.
Single-cell sequencing was simulated by sampling from the same populations used to evaluate alphabetr and including both the dropping of chains and in-frame sequencing errors. In these simulations, the parent population contains 2100 clones with 25 clones representing the top 50% of the clones ranked by abundance. The results were evaluated for (A) top depth, (B) tail depth, and (C) overall depth. The dashed lines show the mean performance of alphabetr applied to five plates using the high-mixed sampling strategy and a threshold of 0.6 (values taken from Fig 3). The single-cell sequencing results are averages of 200 simulations.

