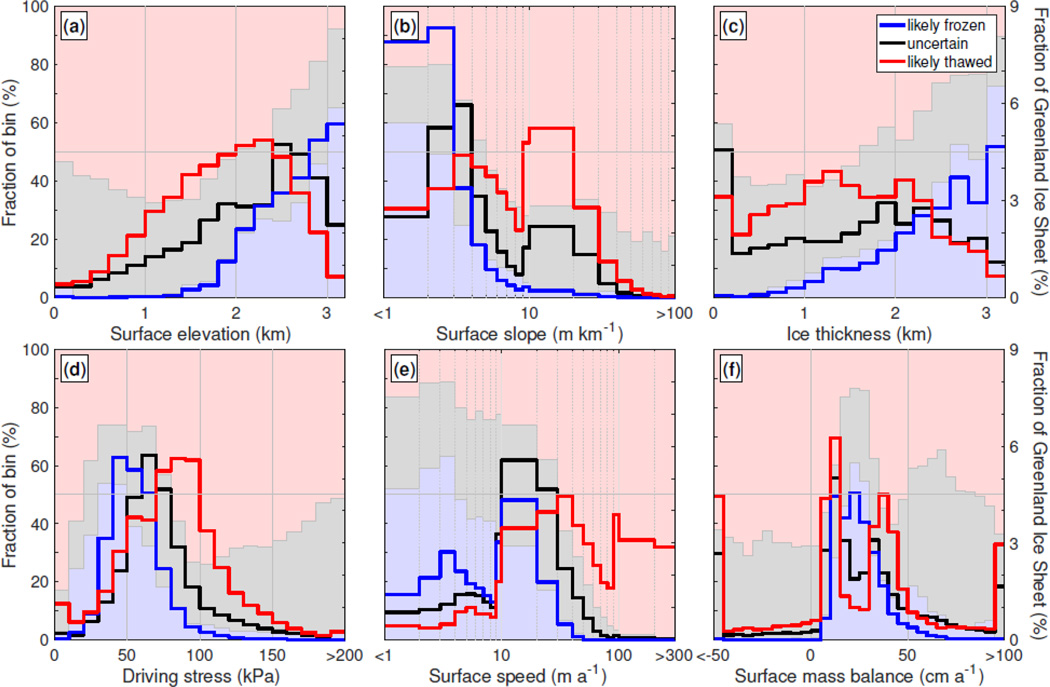
Figure 12.
(right y-axis; lines) Areal distributions of readily observed or inferred GrIS properties as a function of likely basal thermal state (L ; Figure 11). (left y-axis; background fill) Relative fraction of the three possible values of L (likely frozen, uncertain or likely thawed) contained within each bin. (a) Surface elevation and (b) slope are derived from GIMP [Howat et al., 2014], (c) ice thickness from Morlighem et al. [2014], (d) driving stress from Figure 1b, (e) surface speed from Figure 8a and (f) surface mass balance from MAR (same as in Figure 11).

