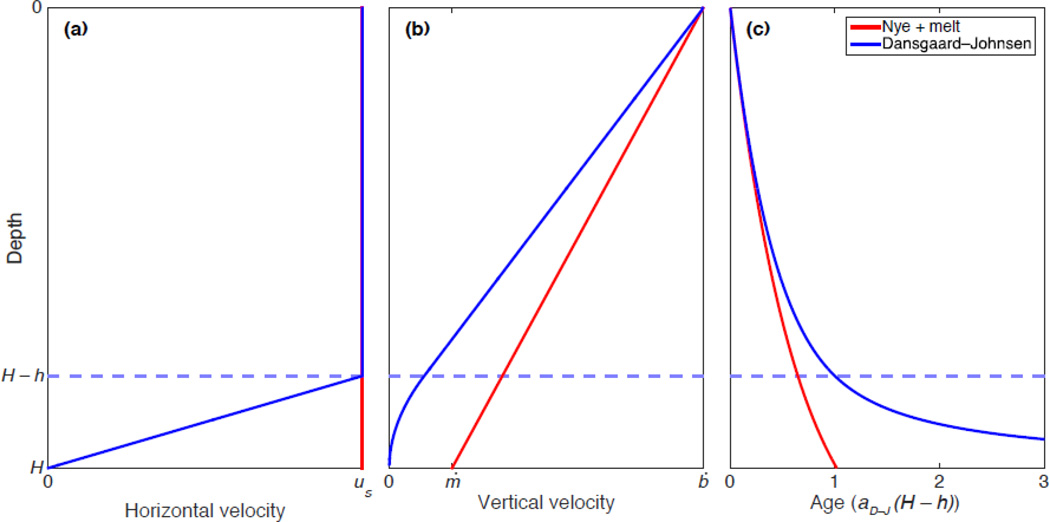
Figure 2.
Schematic of Nye + melt (red) and Dansgaard–Johnsen (blue) 1-D ice-flow models in terms of their relative depth profiles (normalized by ice thickness H) of (a) horizontal velocity, (b) vertical velocity and (c) age. The underlying physical assumptions regarding the depth profiles of horizontal velocity for each model lead to the depth–age relationships shown. This latter modeled quantity (age) is that which we compare to observations (dated radiostratigraphy) to then infer the basal melt rate (ṁ) and shear layer thickness (h). In this schematic, age is normalized by its value at H − h in the Dansgaard–Johnsen model.

