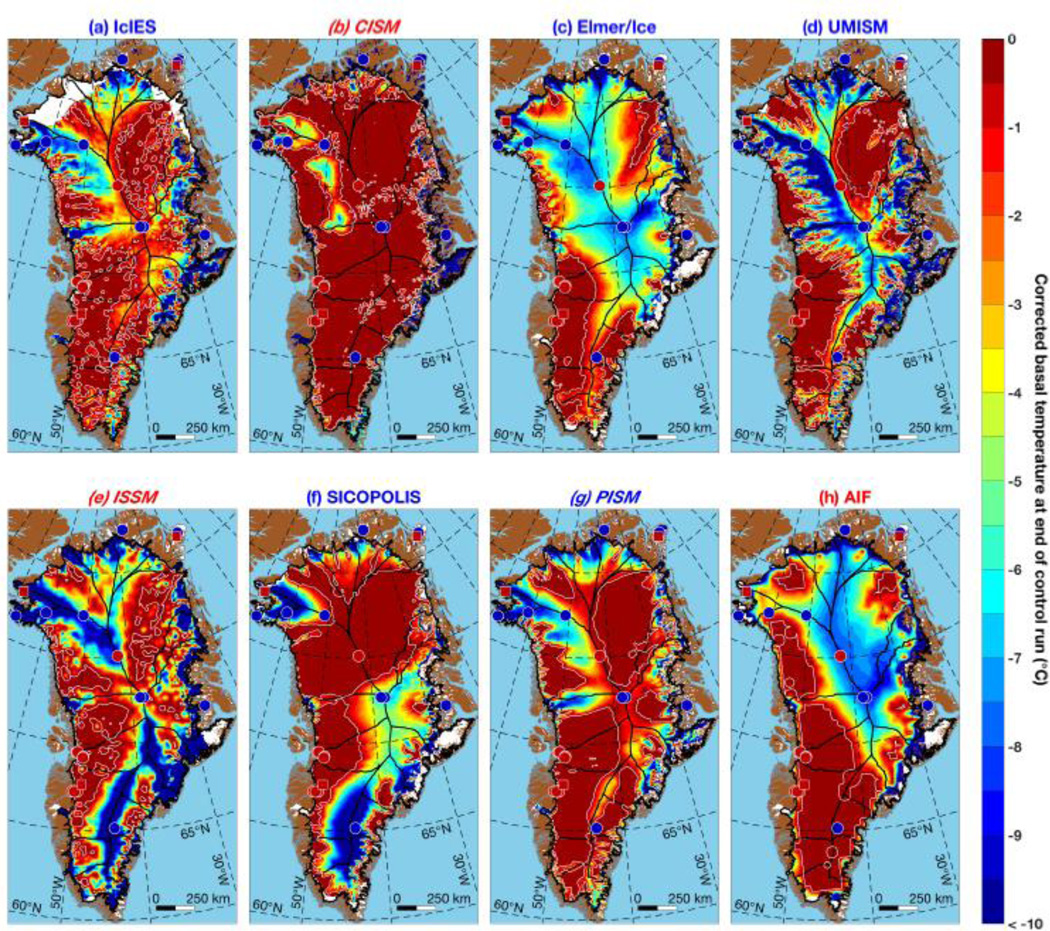
Figure 3.
Modeled pressure-melting-corrected basal temperature across the GrIS from the end of the SeaRISE control-run experiments. The CISM, ISSM and PISM instances (panels b, e, and g; model names italicized) are improved relative to those included in the SeaRISE effort. Models with blue titles were initialized using various paleoclimatic forcings, whereas models with red titles assimilated modern data to determine their geometry and dynamics. The IcIES model is also slightly revised from that used in the SeaRISE experiments, and the AIF model uses a cubic exponent for the power-law relationship between basal motion and friction. White contours represent where , the temperature cut-off above which we assume the bed is thawed (Table 2).

