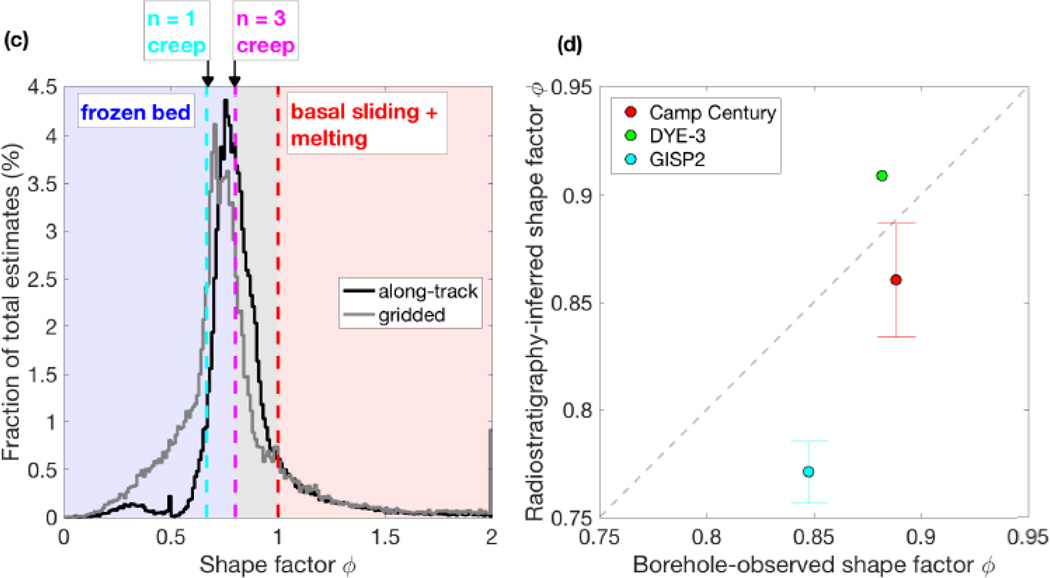
Figure 7.
(a) Histogram of along-track and gridded shape factor φ values (Figure 5c,f), overlain on the qualitative physical interpretation of φ values. Note that the extent of these values does not typically reach the ice-sheet margin and includes ice divides. The small peak at φ = 0.5 for the along-track values is an anomaly associated with the optimization method that can lead to h = H (Equation 5). (b) Comparison between borehole-observed and radiostratigraphy-inferred φ values from radar transects that pass within 3 km of the boreholes. For boreholes with multiple radiostratigraphy-inferred estimates of φ, the standard deviation is also shown using error bars.

