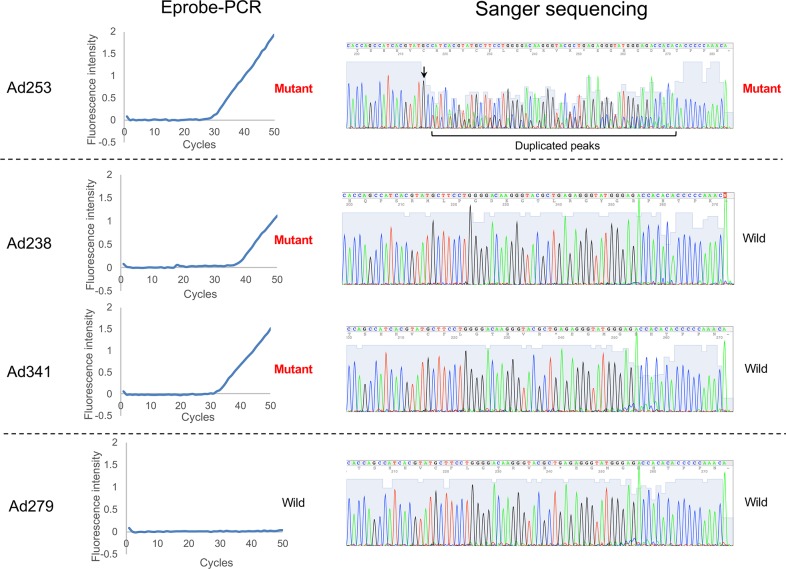
Fig 3. Comparison of Eprobe-PCR and Sanger methods.
The left half of Fig 3 shows the amplification curves of Eprobe-PCR, and the right half shows the electrogram of Sanger sequencing. “4Peaks” was used to view and edit the sequence trace files (http://nucleobytes.com/4peaks/).

