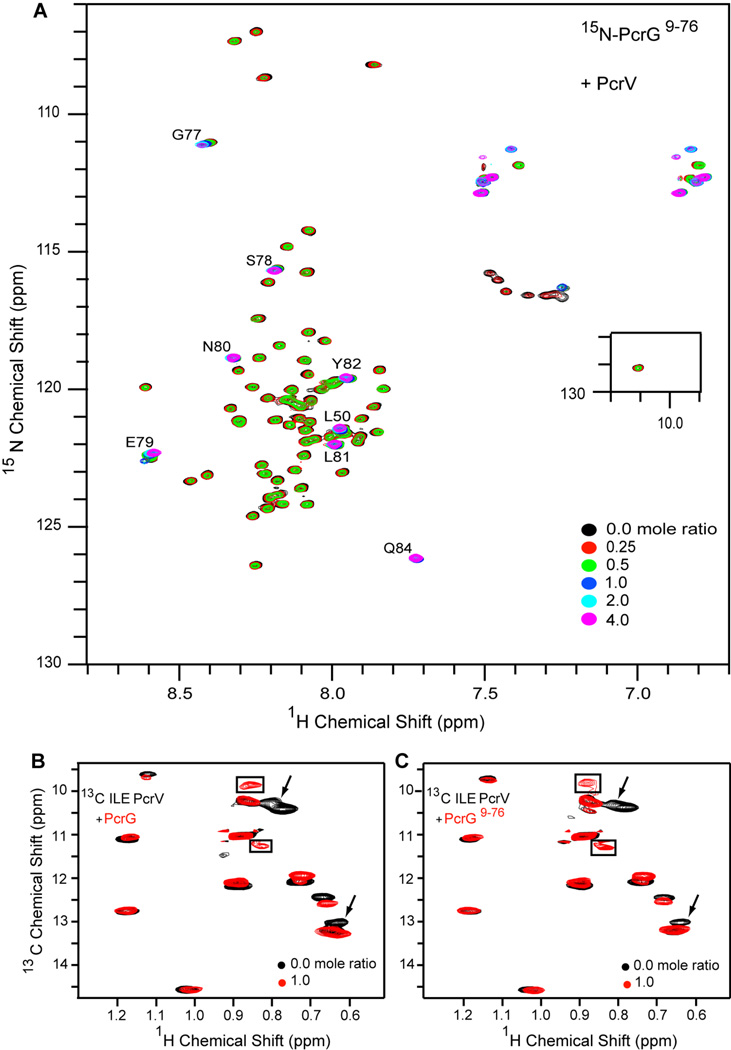
Figure 7. NMR titrations of PcrG and PcrV.
(A) Six overlaid 2D 1H-15N HSQC spectra of 15N-labeled PcrG9–76 titrated with increasing amounts of PcrV. (B, C) Two overlaid 2D 1H-13C HSQC spectra of isoleucine 13Cδ1 methyl labeled PcrV in complex with (B) PcrG and (C) PcrG9–76 in a 1:1 ratio. The slow-exchange peaks (boxed), and peaks in fast-exchange (arrows) are indicated.

