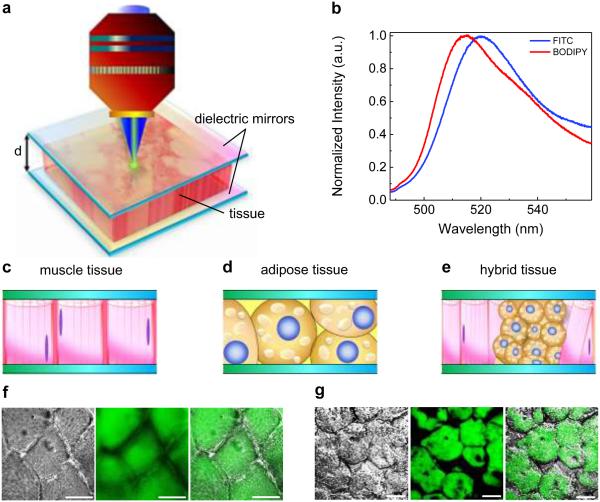
Figure 1. Schematic showing the concept of a tissue laser.
a, Illustration of the tissue lasing when a tissue is sandwiched within a high-Q Fabry-Pérot (FP) cavity. The thickness of tissue (i.e., the cavity spacing) is denoted as d. During the experiment, the sample was excited by a pulsed optical parametric oscillator (OPO) (pulse width=5 ns; wavelength=465 nm). b, Normalized fluorescence emission spectra of FITC in water (blue curve) and BODIPY in ethanol (red curve). c-e, Different types of tissues investigated in this work, including muscle tissue (c), adipose tissue (d), and hybrid tissue (e). f, Microscopic images of myocytes stained with FITC (from left to right): differential interference contrast (DIC) image, confocal microscopy image, and overlap image. g, Microscope images of adipocytes stained with BODIPY (from left to right): DIC image, confocal microscopy image, and overlap image. Scale bars, 20 μm.

