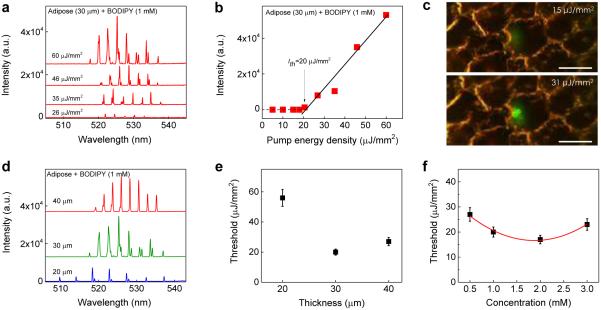
Figure 4. Lasing in adipose tissue.
a, Examples of lasing spectra of adipose tissue (30 μm) stained with BODIPY (1.0 mM) under various pump energy densities. Curves are vertically shifted for clarity. b, Spectrally integrated (520 nm – 535 nm) laser output as a function of pump energy density extracted from the spectra in a. The solid lines are the linear fit above the lasing threshold, which is approximately 20.0 μJ/mm2. c, CCD images of the muscle tissue laser output below (15 μJ/mm2) and above (31 μJ/mm2) the lasing threshold. The image shows clear boundaries of several adipocytes, in which the laser beam is focused on only one of the fat cells. Scale bars, 20 μm. d, Lasing spectra of adipose tissues of different thicknesses above the lasing threshold. e, Laser threshold for different tissue thicknesses. The concentration of BODIPY used to stain the tissue was 1.0 mM. Error bars were based on three individual measurements at different sites. f, Laser threshold with different concentrations of BODIPY used to stain the tissue at the fixed tissue thickness (and hence the cavity length) of 30 μm. The solid curve is a quadratic fit to guide an eye. Error bars were based on three individual measurements at different sites. Details of the lasing spectra and threshold plots of all data points in e and f can be found in Figs. S7 and S8.

