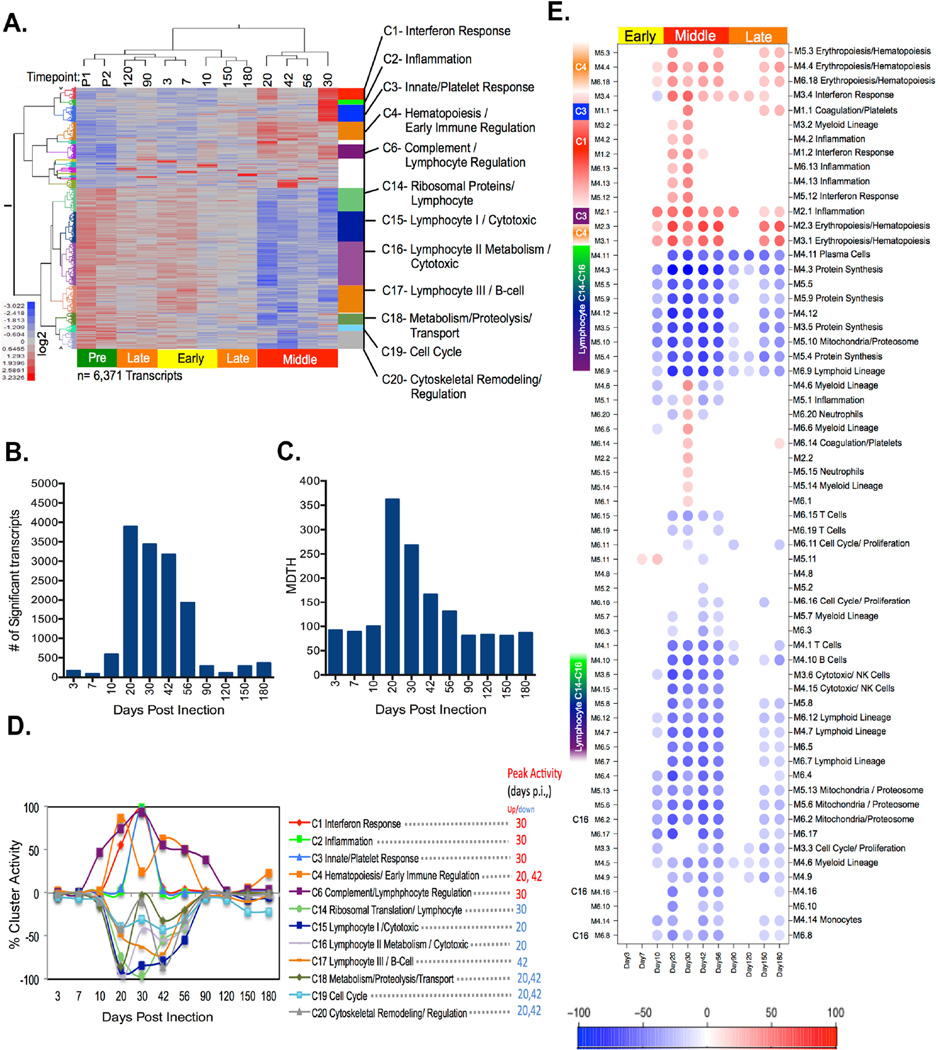
Figure 1. Supervised LMMA reveals three distinct transcriptional phases following Mtb infection.
(A) Two-way hierarchical clustering of LMMA selected transcripts (columns) (FDR=0.05) followed by k-means clustering (kn=20) were used to compare each post-infection time point (rows) with the pre-infection baseline. Those clusters (12/20) with significant ontology and network associations determined by Ingenuity Pathway Analysis (IPA) are annotated. (B) The total number of differentially expressed genes determined by LMMA at each post-infection time point are shown. (C) The amplitude of post-infection transcript perturbations as measured by the Molecular Distance to Health are shown. (D) Cluster activity at each time point post-infection is represented as the percentage of all genes within each cluster that are differentially expressed using LMMA. (E) Transcripts from NHP were also evaluated using pre existing human expression modular framework. Module activity scores representing the percentage of transcripts that are either over-expressed (red) or under-expressed (blue) in 62 predefined human co-expression modules. Module activity was hierarchically clustered to group modules with similar activity patterns over time. Those clusters with >15% representations are presented here. Red color represents over expression over pre-infection, whereas blue color represent under expression. Color intensity represents the percent of each module that is differentially expressed from pre-infection baseline. K-means clusters from 1D were mapped to those framework modules which share >15% similar transcript constituents.

