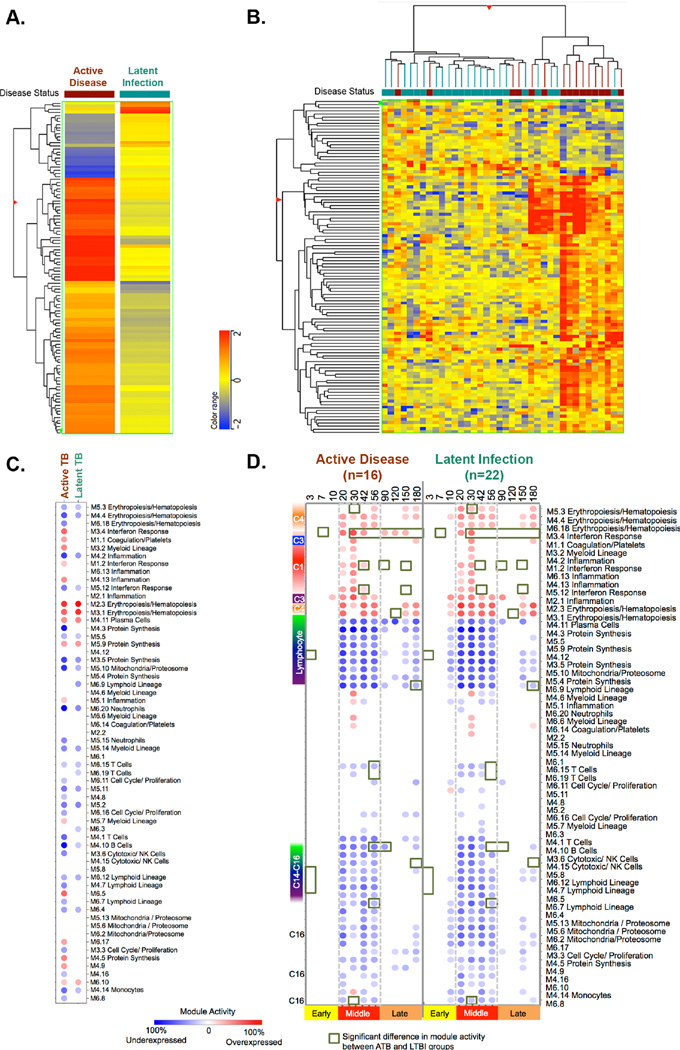
Figure 2. Differential gene expression at the time of clinical diagnosis.
At the time of clinical diagnosis 109 transcripts were differentially expressed between animals with active disease and latent infection (Fold Change >1.5). (A) The mean differential signature was hierarchically clustered based the genes with similar differential expression between active disease and latent infection as clinical groups. (B) Two-way hierarchical clustering was used to cluster animals and transcripts with similar patterns of expression. NHPs with latent infection are marked in green, while those that developed active disease are in maroon (C) Transcripts from NHP at the time of clinical diagnosis were evaluated using a pre-existing human gene expression module framework for animals that either developed active disease (maroon) or remained latently infected (green). (D) Transcripts from NHP were evaluated using a pre-existing human gene expression module frame work for animals that either developed active disease (on the left) or remained latently infected over the course of Mtb infection. Module activity scores representing the percent of genes that are either over-expressed (red) or under-expressed (blue) relative to the pre-infection baseline are calculated. Red color represents over expression compared to pre-infection, whereas blue color represent under expression. The intensity of the color represents the degree of differential expression from baseline. Module activity >15% are visualized. Green squares indicate significant differential expression (Module activity) between animals with active disease and latent infection.

