
Figure 5.
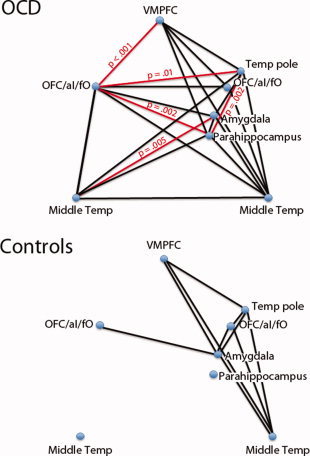
Relationships between brain regions. A Box M test revealed significant group differences among patterns of intersubject correlations between brain regions for the first piece of evidence on certain sequences. Positive correlations between individual pairs of brain regions are shown for each group (P < 0.01, black lines). Red lines represent correlations that are greater in OCD patients than controls (P < 0.01). VMPFC, ventromedial prefrontal cortex; OFC/aI/fO, orbitofrontal cortex/anterior insula/frontal operculum; Temp, temporal. [Color figure can be viewed in the online issue, which is available at wileyonlinelibrary.com.]