Figure 2.
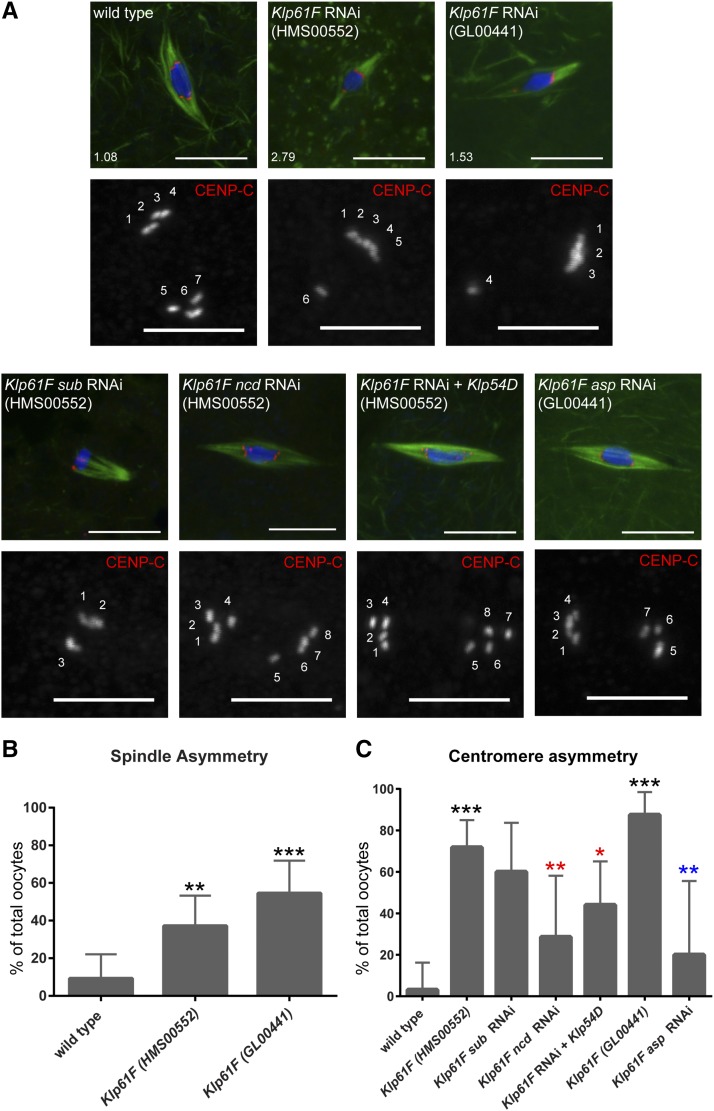
KLP61F promotes spindle and centromere symmetry in oocytes. (A) Confocal images of late-stage oocytes. DNA is shown in blue, tubulin in green, and CENP-C in red in merged images and white in single channel images. Single channel images are zoomed in relative to merged to highlight CENP-C foci. Numbers in lower left corner of merged images represent spindle asymmetry of pictured oocyte. CENP-C foci are numbered in single channel images. Bars, 10 µm in merged, 5 µm in CENP-C single channel images. (B) Bar graph showing the percentage of total oocytes with spindle asymmetry >1.5. Significance determined by Fisher’s Exact Test: *** P < 0.0001, ** P = 0.004. Error bars show 95% confidence intervals. (C) Bar graph showing the percentage of total oocytes with at least 75% of centromeres associated with a single spindle pole. Significance determined by Fisher’s Exact Test: *** P < 0.0001, ** P < 0.01, * P = 0.04. Comparisons with wild type shown by black asterisks, comparisons with Klp61F (HMS00552) shown by red asterisks, and comparisons with Klp61F (GL00441) shown by blue asterisks. Error bars show 95% confidence intervals.

