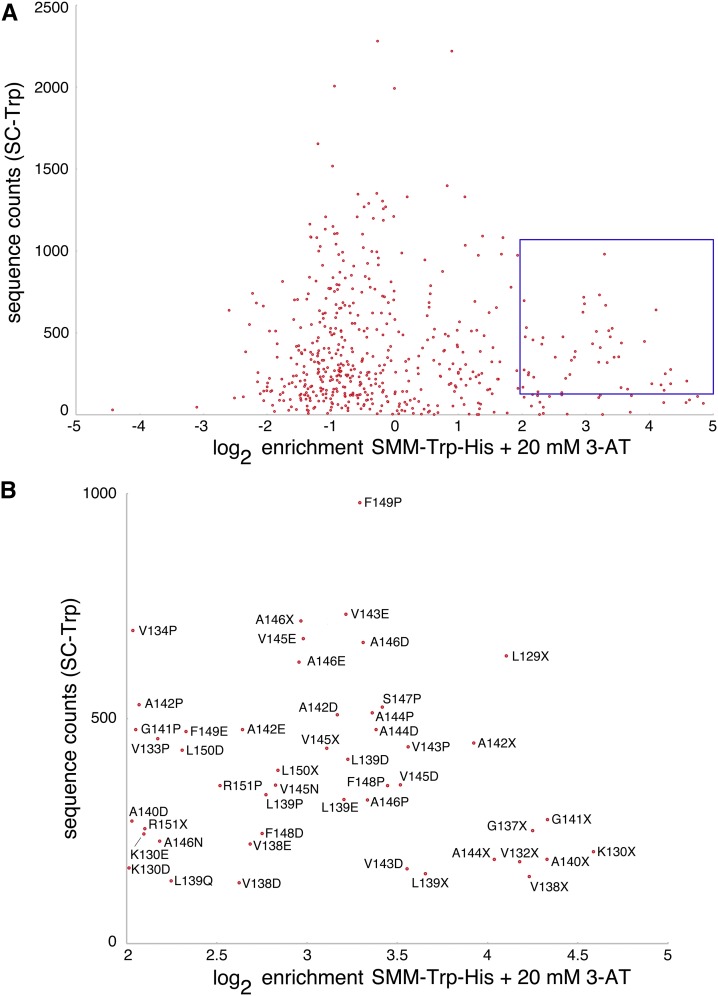
Figure 4.
Identification of abundant Gal4–sfGFP–Fis1p clones that are highly enriched upon selection for Gal4–sfGFP–Fis1p nuclear translocation. (A) TA substitution mutations are plotted, with log2 enrichment values provided on the x-axis and sequence counts recovered from the starting pool (SC −Trp) provided on the y-axis. Those replacement mutations that are within the top 75th percentile of mutant abundance in the starting pool and enriched at least fourfold following selection in SMM −Trp −His medium containing 20 mM 3-AT are highlighted in a blue box. (B) Expansion of the highlighted region in A showing specific TA mutations.

