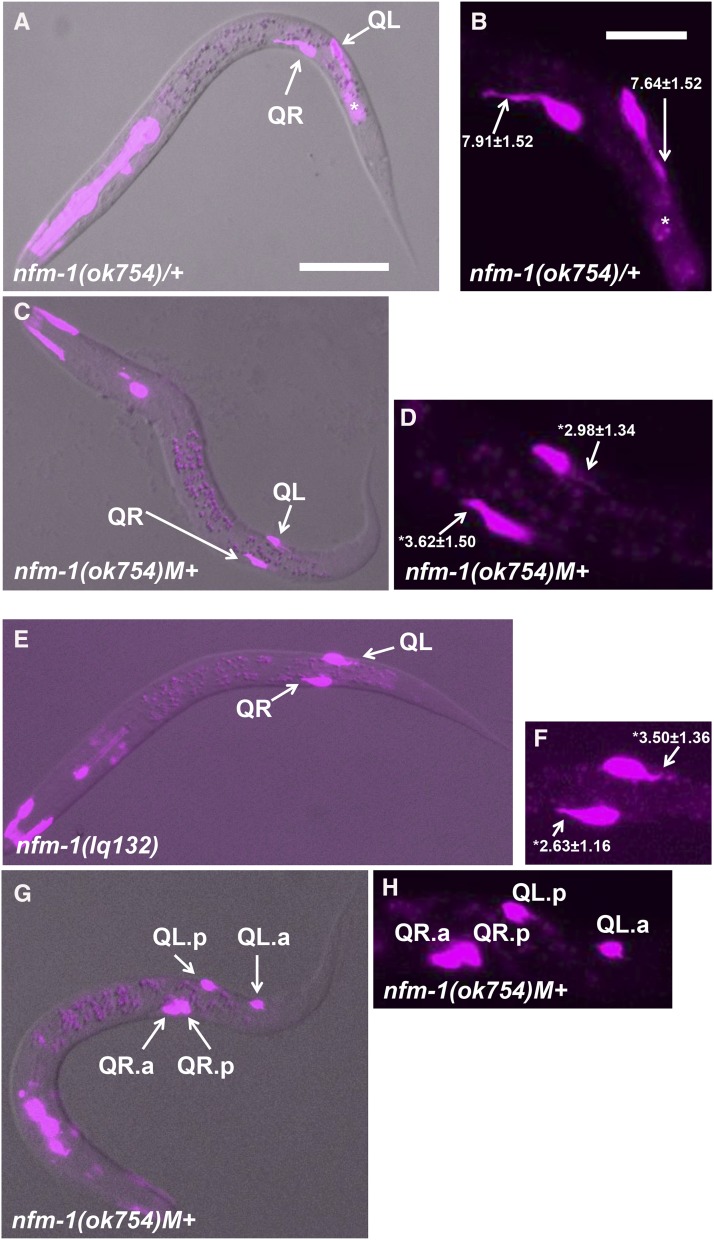
Figure 3.
Early Q migrations in nfm-1 mutants. Fluorescent micrographs of L1 animals with ayIs9[egl-17::gfp] expression are shown (magenta). Anterior is to the left. (A, C, E, and F) Merged with a differential interference contrast image. (B, D, F, and G) Enlarged images of the migrating Q cells. The average length and SE of Q protrusions in micrometers are indicated in B, D, and F (n = 20 in all cases). The asterisks indicate statistical significance compared to wild type (t-test; P < 0.0001). (A and B). Wild-type Q cells display robust protrusions at 1–2.5 hr posthatching (arrows). This animal is a balanced nfm-1(ok754)/hT2 heterozygote with one wild-type copy of nfm-1. The bright fluorescence in the anterior is gfp expression in the pharynx associated with the hT2 balancer chromosome, and the fluorescence posterior to the Q cells is background associated with the ayIs9[Pegl-17::gfp] transgene (asterisk). (C and D). An nfm-1(ok754) homozygote with wild-type maternal contribution (M+) at 1–2.5 hr posthatching displays Q cells with shortened protrusions compared to wild-type (arrows). (E and F). An nfm-1(lq132) homozygote at 1–2.5 hr posthatching displays shortened protrusions (arrows). (G and H). An nfm-1(ok754)M+ animal at 6–7 hr posthatching. QL.p has migrated posteriorly, whereas both QR.a and QR.p have failed to migrate anteriorly and remain near their birthplace. Bars, 10 μm for A, C, E, and F and 5 μm for B, D, F, and G.

