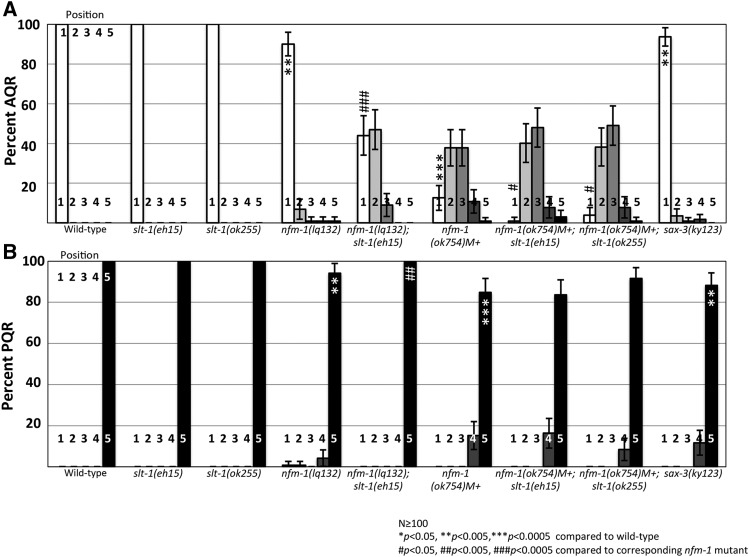
Figure 7.
slt-1 enhances nfm-1 AQR migration defects. (A) Percentage of AQR in each position, quantified as in Figure 2. (B) PQR migration. Asterisks indicate significant difference from wild type (N > 100; * P < 0.05, ** P < 0.005, *** P < 0.0005, Fisher’s exact test). Pound signs indicate, for that position, a significant enhancement of the corresponding nfm-1 mutant (N > 100; # P < 0.05, ## P < 0.005, ### P < 0.0005, Fisher’s exact test). Error bars represent two times the SE of the proportion.

