Figure 3.
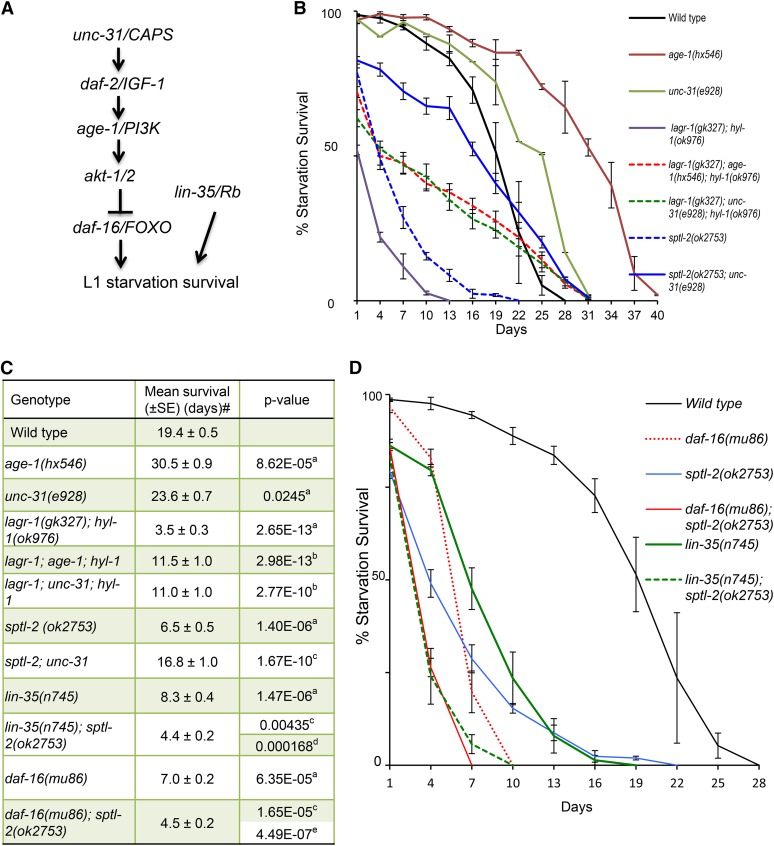
Ceramide may regulate L1 starvation survival by affecting both the Rb and IIS pathway-dependent and -independent functions. (A) A simplified diagram of the Rb and IIS pathway and their relationship with L1 starvation survival. (B) Survival curves showing that the L1 starvation survival defect of the CerS(rf) mutant and the sptl-2(lf) mutant was partially rescued by unc-31(lf) and age-1(rf). Percentage survival is defined as the percentage of animals surviving to the third larval stage and beyond on food after L1 worms were starved in S-basal buffer for the indicated time. Errors bars represent SE at each time point indicated. The starvation survival data for wild type, CerS(rf), and sptl-2(lf) are the same as that presented in Figure 1B. (C) Table of mean survival and P-values for survival curves presented in (B) and (D). # The average of the mean survival rate of all individual replicates for each strain is presented here. The combination of sptl-2(lf) with daf-16(lf) or lin-35/Rb(lf) resulted in more severe defects than each single mutant. a,b,c,d,eP values indicate the significance of the difference from wild type (aP), CerS(rf) (bP), sptl-2(ok2753) (cP), lin-35(n745) (dP), and daf-16(mu86) (eP) respectively. (D) Survival curves showing the defect of sptl-2(lf) was enhanced by either daf-16(lf) or lin-35/Rb(lf). % Survival is defined as the percentage of animals surviving to the third larval stage and beyond on food after L1 worms were starved in S-basal buffer for the indicated time. Errors bars represent SE at each time point indicated. The starvation survival data for wild type and sptl-2(lf) are the same as that presented in Figure 1B. Raw data and statistical analyses for individual starvation survival experiments for Figure 3 are presented in Table S1.

