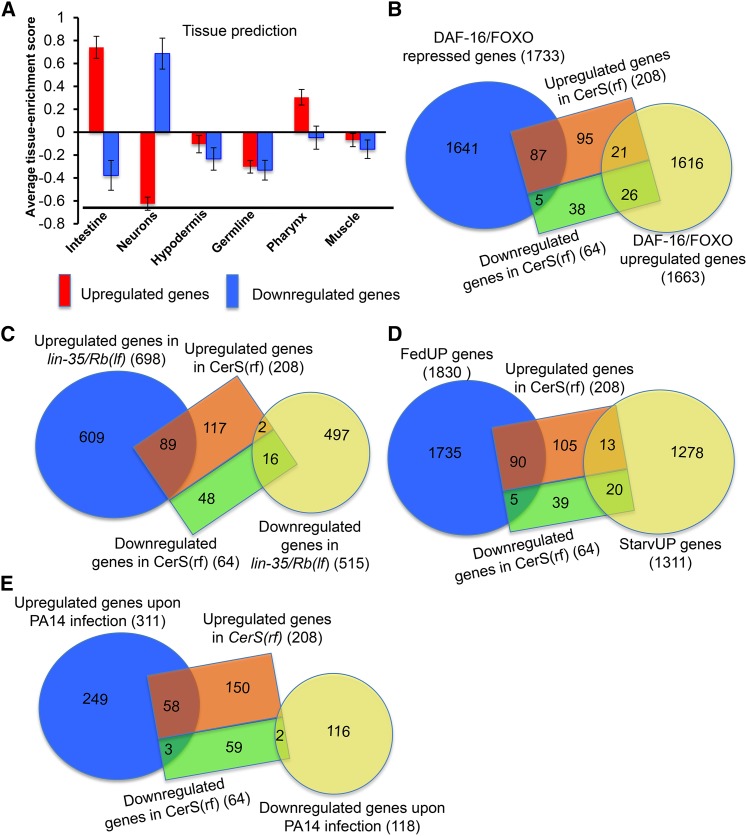
Figure 4.
Ceramide synthases regulate the expression of genes regulated by the IIS-pathway, Rb, feeding, starvation condition, and genes induced by pathogen. (A) Tissue enrichment analysis. Tissue enrichment scores were calculated by the online program Tissue Expression Prediction for C. elegans (Chikina et al. 2009). (B) Diagram showing the overlap between dysregulated genes in CerS(rf) and DAF-16/FOXO responsive genes (Tepper et al. 2013). The lists of overlapping genes are included in Table S2, B and C. The statistical significance of the overlap is presented in Table S4. (C) Diagram showing the overlap between dysregulated genes in CerS(rf) and lin-35/Rb (Cui et al. 2013). The list of overlapping genes is included in Table S2D. The statistical significance of the overlap is presented in Table S4. (D) Diagram showing the overlap between dysregulated genes in CerS(rf) and FedUP genes or StarvUP genes (Baugh et al. 2009). The lists of overlapping genes are included in Table S2, F and G. The statistical significance the overlap is presented in Table S4. (E) Diagram showing the overlap between dysregulated genes in CerS(rf) and previously identified pathogen (P. aeruginosa, PA14)-inducible genes (Troemel et al. 2006). The list of overlapping genes is included in Table S2H. The statistical significance of the overlap is presented in Table S4.

