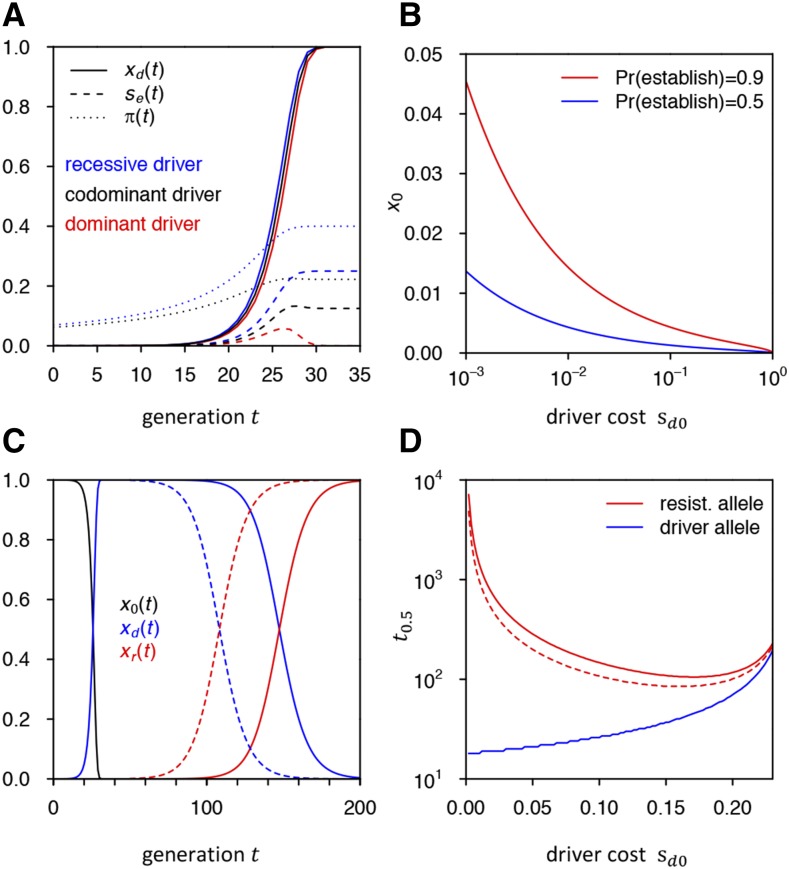
Figure 5.
(A) Driver allele frequency trajectories, effective fitness advantage of resistance allele, and establishment probabilities under recessive, codominant, and completely dominant driver fitness costs in our standard model. is not visible in the dominant scenario as it is very close to zero. (B) Threshold frequencies at which a resistance allele needs to be present to have the given establishment probability in the case of a completely dominant driver with cost (C) Replacement of driver by resistance allele. Shown is the deterministic frequency trajectory of a driver allele in our standard model and its replacement by a resistance allele from the SGV that was present as a single copy (solid line) or 100 copies (dashed line) when the driver was introduced. (D) Time until resistance allele and driver allele reach 50% population frequency in (C) when varying driver cost Once driver cost reaches in our model, the driver will be outpaced by the resistance allele before it can reach 50%.

