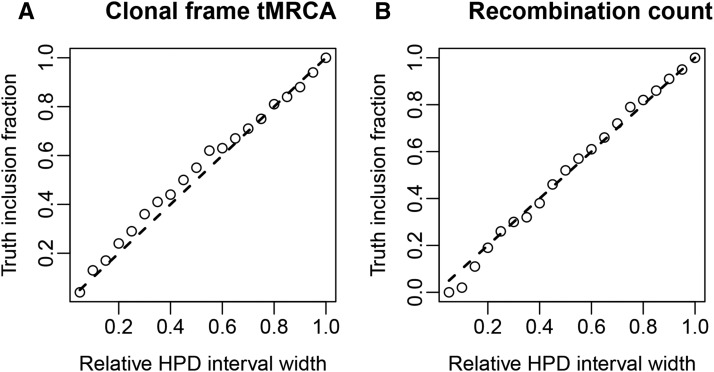
Figure 5 .
Coverage fraction vs. HPD interval width for (A) the CF tMRCA and (B) the recombination event count posteriors inferred from simulated sequence data. The ○ represents the observed coverage fraction, while the dashed lines indicate the coverage fraction to be expected from a well-calibrated analysis.

