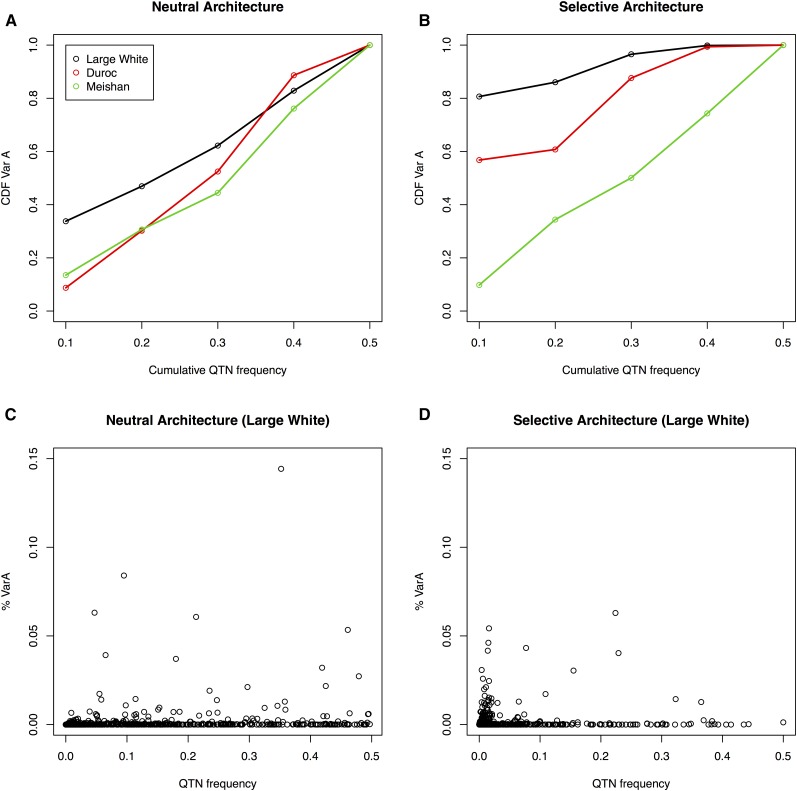
Figure 2.
Distribution of genetic variance according to QTN frequency and genetic architecture. (A) Fraction of genetic variance explained by all QTNs at MAF below frequency for the neutral architecture. (B) Idem for the selective architecture. (C) Fraction of genetic variance explained by each QTN vs. its MAF in the neutral architecture for Large White. (D) Idem for the selective architecture. CDF, cumulative density function; MAF, minimum allele frequency; QTN, quantitative trait nucleotide.

