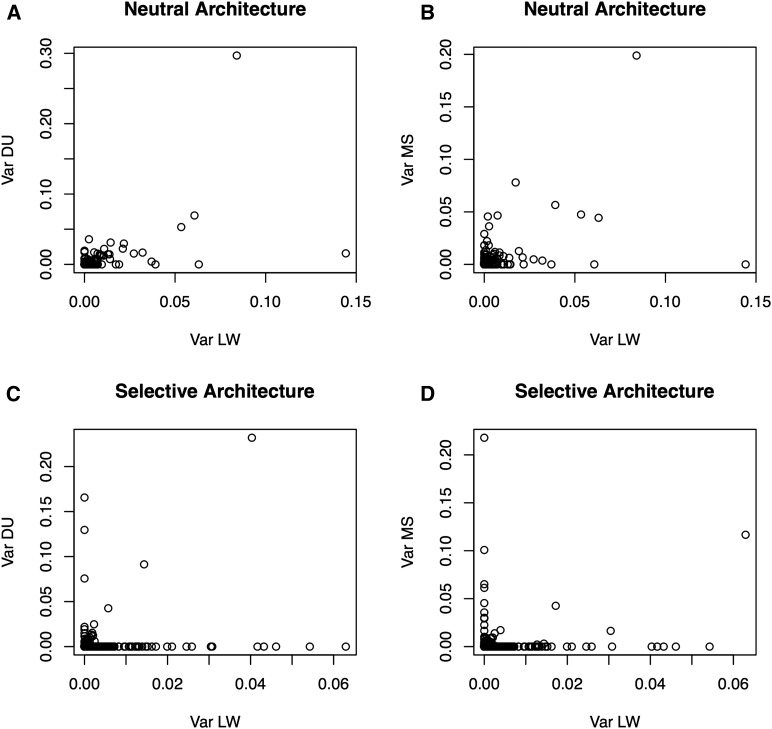
Figure 3.
Individual QTN variance contribution across breeds. (A) LW vs. DU, neutral architecture; (B) LW vs. MS, neutral architecture; (C) LW vs. DU, selective architecture; (D) LW vs. MS, selective architecture. Values are percentages of total genetic variance, and are computed assuming linkage equilibrium. DU, Duroc; LW, Large White; QTN, quantitative trait nucleotide.

