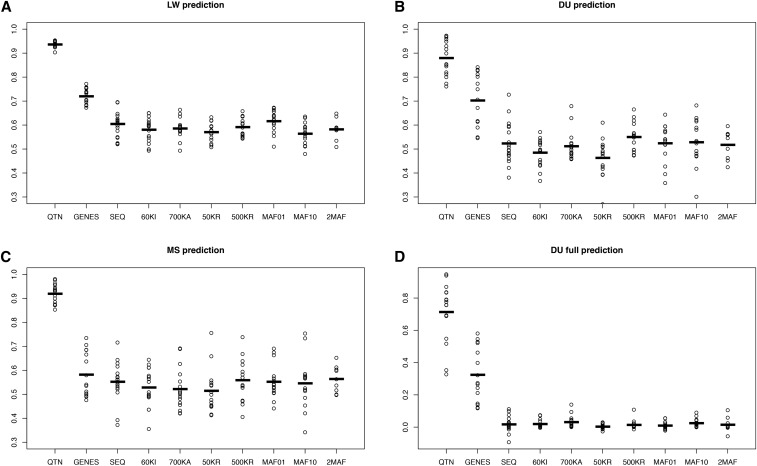
Figure 5.
Performance of different GBLUP models across scenarios for the selective architecture. (A) 50% of LW from the last generation were removed and predicted. (B) 50% of DU from the last generation removed. (C) 50% MS from the last generation removed. (D) All DU removed. The following models are shown: QTN, GRM computed with all QTNs; SEQ, all SNPs; 60KI, Illumina’s 60k array; 700KA, Affymetrix; 50KR, 50,000 random SNPs; 500KR, 500,000 random SNPs; MAF01, 1 million SNPs with MAF < 0.01; MAF10, 1 million SNPs with MAF > 0.1; and 2MAF, the model uses MAF01 and MAF10. In the GENES model, GRM was obtained with the SNPs segregating in any of the genes containing a QTN. Values reported are accuracies, defined as squared correlation between true and predicted genetic values. Dots correspond to each of the 10 replicates, horizontal bars represent the mean. DU, Duroc; GBLUP, genomic best linear unbiased prediction; GRM, genomic relationship matrix; LW, Large White; MAF, minimum allele frequency; MS, Meishan; QTN, quantitative trait nucleotide.

