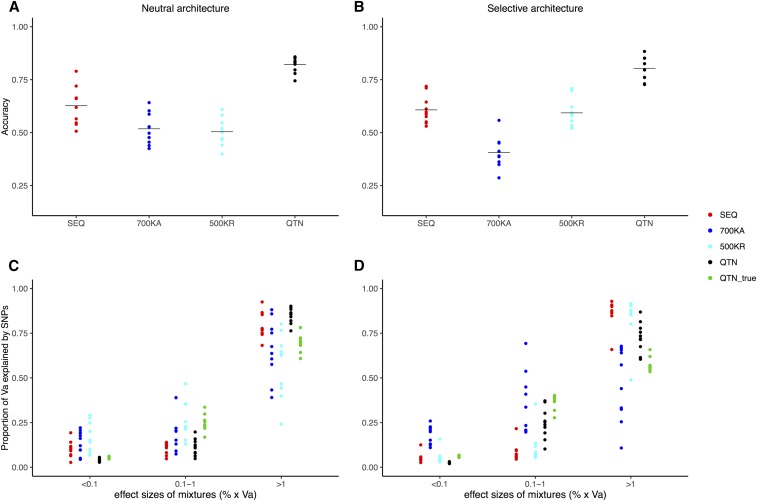
Figure 6.
Performance of BayesR in LW. (A) Accuracy in predicting genetic merit when 50% of LW from the last generation were removed and predicted with BayesR (neutral architecture). (B) Idem for the selective architecture. (C) Fraction of variance explained by SNPs when classified as 10−4, 10−3, and 10−2 units of genetic variance, according to different SNP sets (neutral architecture). (D) Idem for the selective architecture. The following models are shown: QTN, GRM computed with all QTNs; SEQ, the two million SNPs from MAF01 and MAF10 plus the QTNs; 700KA, Affymetrix; and 500KR, 500,000 random SNPs. Accuracy is defined as squared correlation between true and predicted genetic values. Dots correspond to each of the five replicates, horizontal bars in (A and B) correspond to the mean. GRM, genomic relationship matrix; LW, Large White; MAF, minimum allele frequency; QTN, quantitative trait nucleotide; Va, additive variance.

