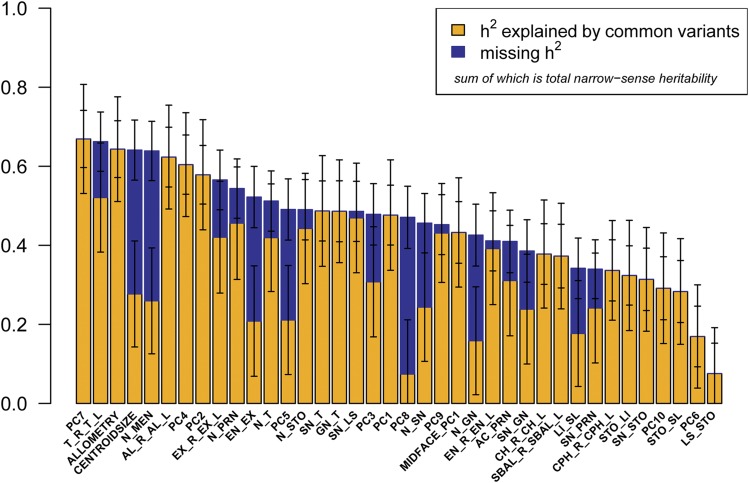
Figure 3.
Heritability of 38 facial traits. The bar plot represents h2g (yellow), missing h2 (blue), and total h2 (yellow + blue) with error bars for all 38 facial phenotypes analyzed. Bars that apparently have no missing h2 (blue) indicate that h2g equals h2; therefore, narrow-sense heritability of that phenotype can be explained fully by common genetic variation.

