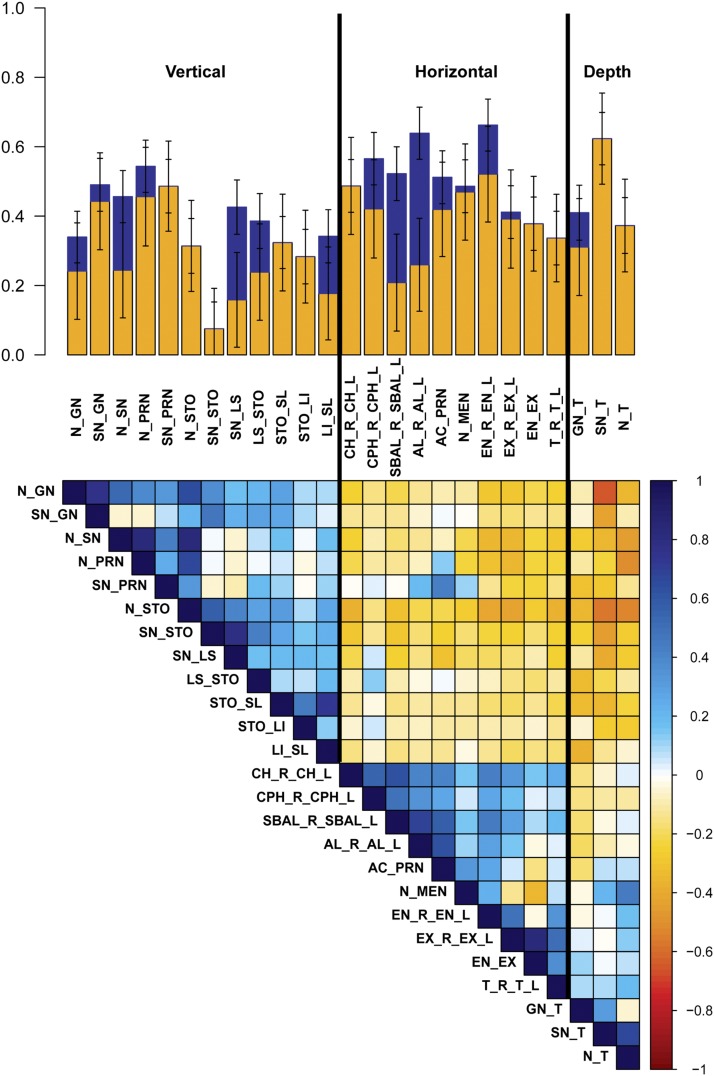
Figure 4.
Heritability of linear distances by measurement orientation. The bar plot represents h2g (yellow), missing h2 (blue), and total h2 (yellow + blue) with error bars for 25 linear distances. Traits are first clustered by orientation, then by facial structure with between-trait phenotypic correlations seen in the colored matrix in the bottom half of the figure.

