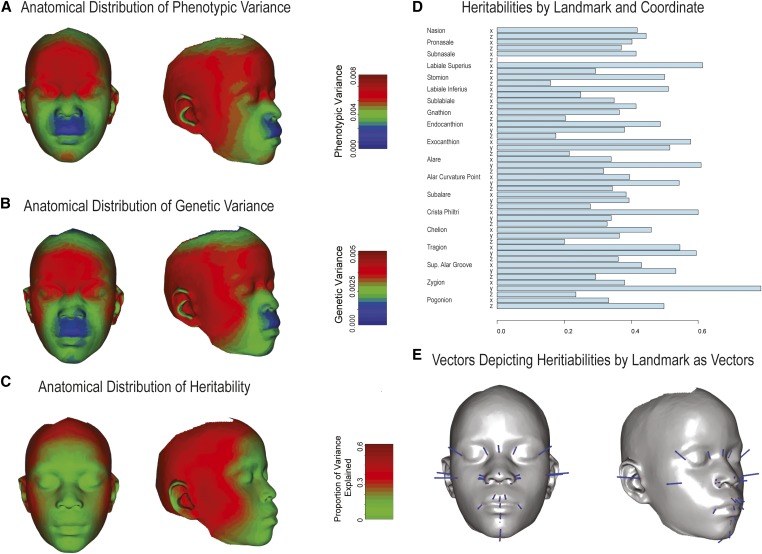
Figure 5.
Distribution of variance components across the face. (A–C) The anatomical distribution of phenotypic and genetic variances as well as heritabilities is shown. These are represented as heatmaps based on a thin-plate-spine morph as described in Materials and Methods. (D) The heritability estimates or the Procrustes-superimposed symmetrized landmarks are shown. (E) The vectors, magnified 10-fold, used to generate the heritability heatmap are depicted.

