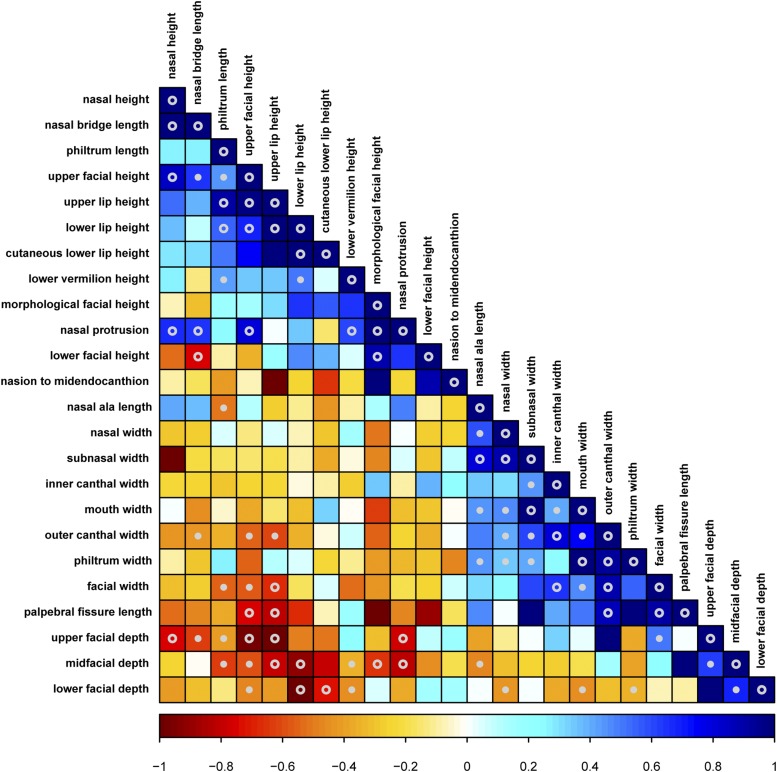
Figure 6.
Pairwise genetic correlation matrix of the linear distances. Genetic correlation was calculated from >15 million common genetic variants. Traits that have high positive genetic correlations with each other are shown in blue, indicating that the same genetic loci alter the magnitude of those traits in the same direction. Traits that have high negative genetic correlations with each other are shown in red, indicating that the same genetic loci are contributing to each phenotype in opposite directions, increasing one while decreasing the other. Genetic correlation estimates that are significantly different (P < 0.05) from 0 to +1 or 0 to −1 are marked with ○ and genetic correlation estimates that are significantly different (P < 0.05) than 0, +1, and −1 are marked with ○.

