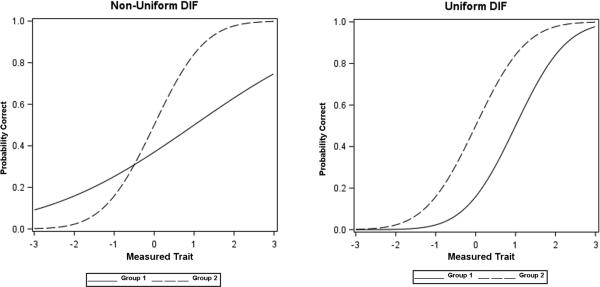
Figure.
The two curves, generated from simulated data, show the differential patterns of non-uniform DIF and uniform DIF for a given item based on two covariates (Group 1, Group 2). In non-uniform DIF (left graph), at low levels of the measured trait, Group 1 scores higher compare to Group 2, but at higher levels of the measured trait, Group 1 scores lower than the other group. In uniform DIF (right graph), Group 1 consistently scores lower than Group 2 across all levels of the measured trait. As an example if men (Group 1) score higher on the Cognitive Impairment item (Item 1.1) than women (Group 2) when both have low Non-motor Experiences of Daily Living trait scores, but score lower on this item when the overall trait score is high, gender-based non-uniform DIF for Item 1.1 would occur; if men consistently have less cognitive impairment and thereby score lower than women on Item 1.1 across all levels of the measured trait of Non-motor Experiences of Daily Living, gender-based uniform DIF exists. (See Supplemental Material for graphs generated from the MDS-UPDRS datasets showing DIF effects for individual items and Parts).

