
Figure 1.
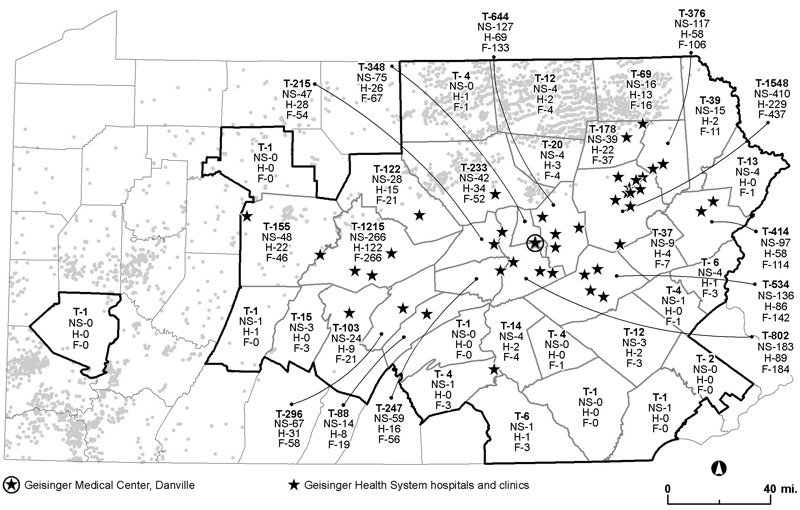
Map of study area. Thick black outlines designate Pennsylvania counties with at least one participant [from U.S. Census Bureau TIGER/line files (U.S. Census Bureau 2010)]. Numbers within the borders of each county indicate the total number of participants (T) and the number with chronic rhinosinusitis symptoms (NS), migraine headache (H), and higher levels of fatigue (F) (data from the Geisinger Clinic). Gray circles show locations of drilled unconventional natural gas wells as of December 2014 (Pennsylvania Department of Environmental Protection 2016). Black stars represent Geisinger hospitals and clinics. Map was made with ArcGIS Desktop (release 10, Esri, Redlands, CA).